You just tell it to install this, uninstall that,
upgrade something, roll back to a previous state and so on.
And it proceeds to do all the heavy lifting
behind the scenes.
It’s basically an automation tool where we,
the human operators, specify our desired end result,
the destination, and then it doesn’t matter if 5, 10, 20,
or 50 actions are necessary to achieve that end result,
to get to that destination,
Helm will go through all the required steps
without bothering us with the details.
But since in the command line,
we don’t give this tool a lot of info except,
“Hey, I want this installed.”
How does it know how to achieve this goal?
Helm knows how to do its job
with the help of what are called charts.
Charts are like an instruction manual for it.
By reading and interpreting their contents,
it then knows exactly what it has to do
to fulfill as user’s request.
As far as the human operators are concerned,
charts are just a bunch of text files.
Each specific file named in a specific way
has a well-defined purpose.
 For example, as discussed before,
in the values.yaml file, we’ll find parameters
that we can pass to the chart
so that everything gets installed
with a configuration options set as we desire.
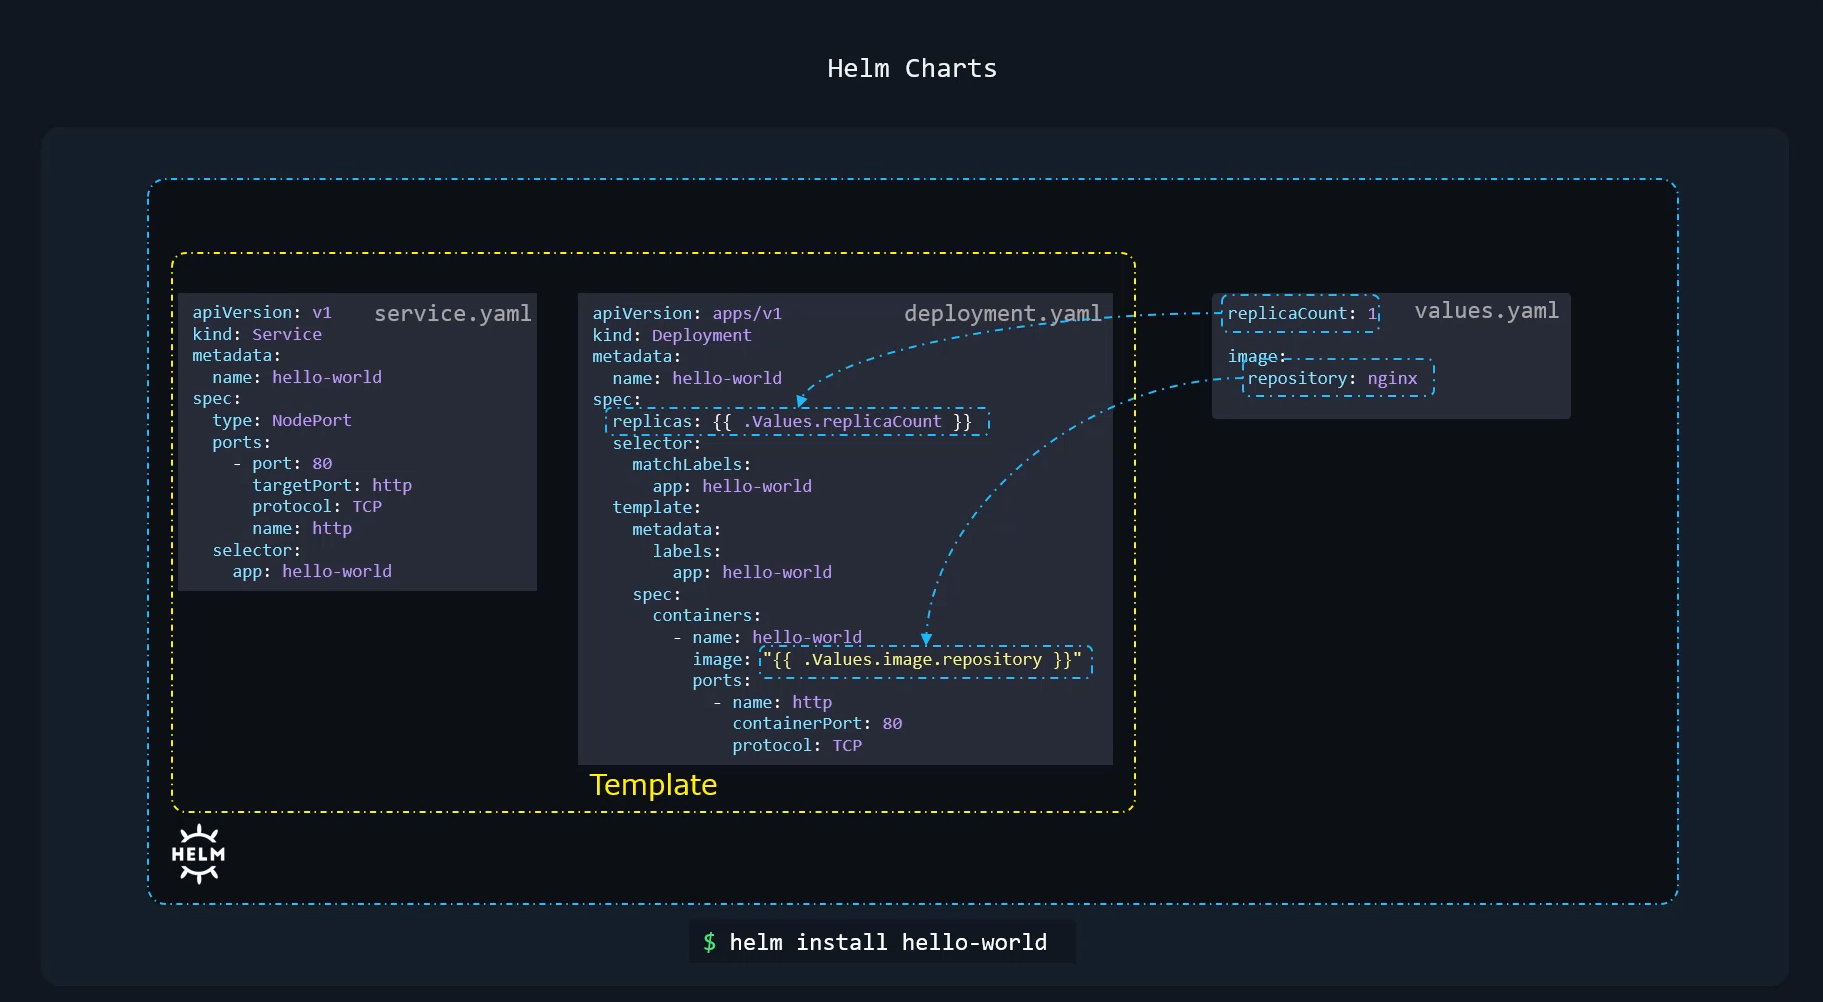
Now, we saw this simple example earlier.
In this case, we have two objects,
a deployment and a service.
And it’s a standard deployment that deploys parts
of an image and a service
that exposes it as a node port service.
However, you might notice the image name
and replicas are specified in a different form.
This is called templating.
The values that go here are part of
the values.yam file,
and we will look into templating itself
in more detail later in this course
and how to form these values.
So the two files are templates.
These are customized using the values
from the values.yaml file
to create the final version of files
required to deploy the application
on the Kubernetes cluster.
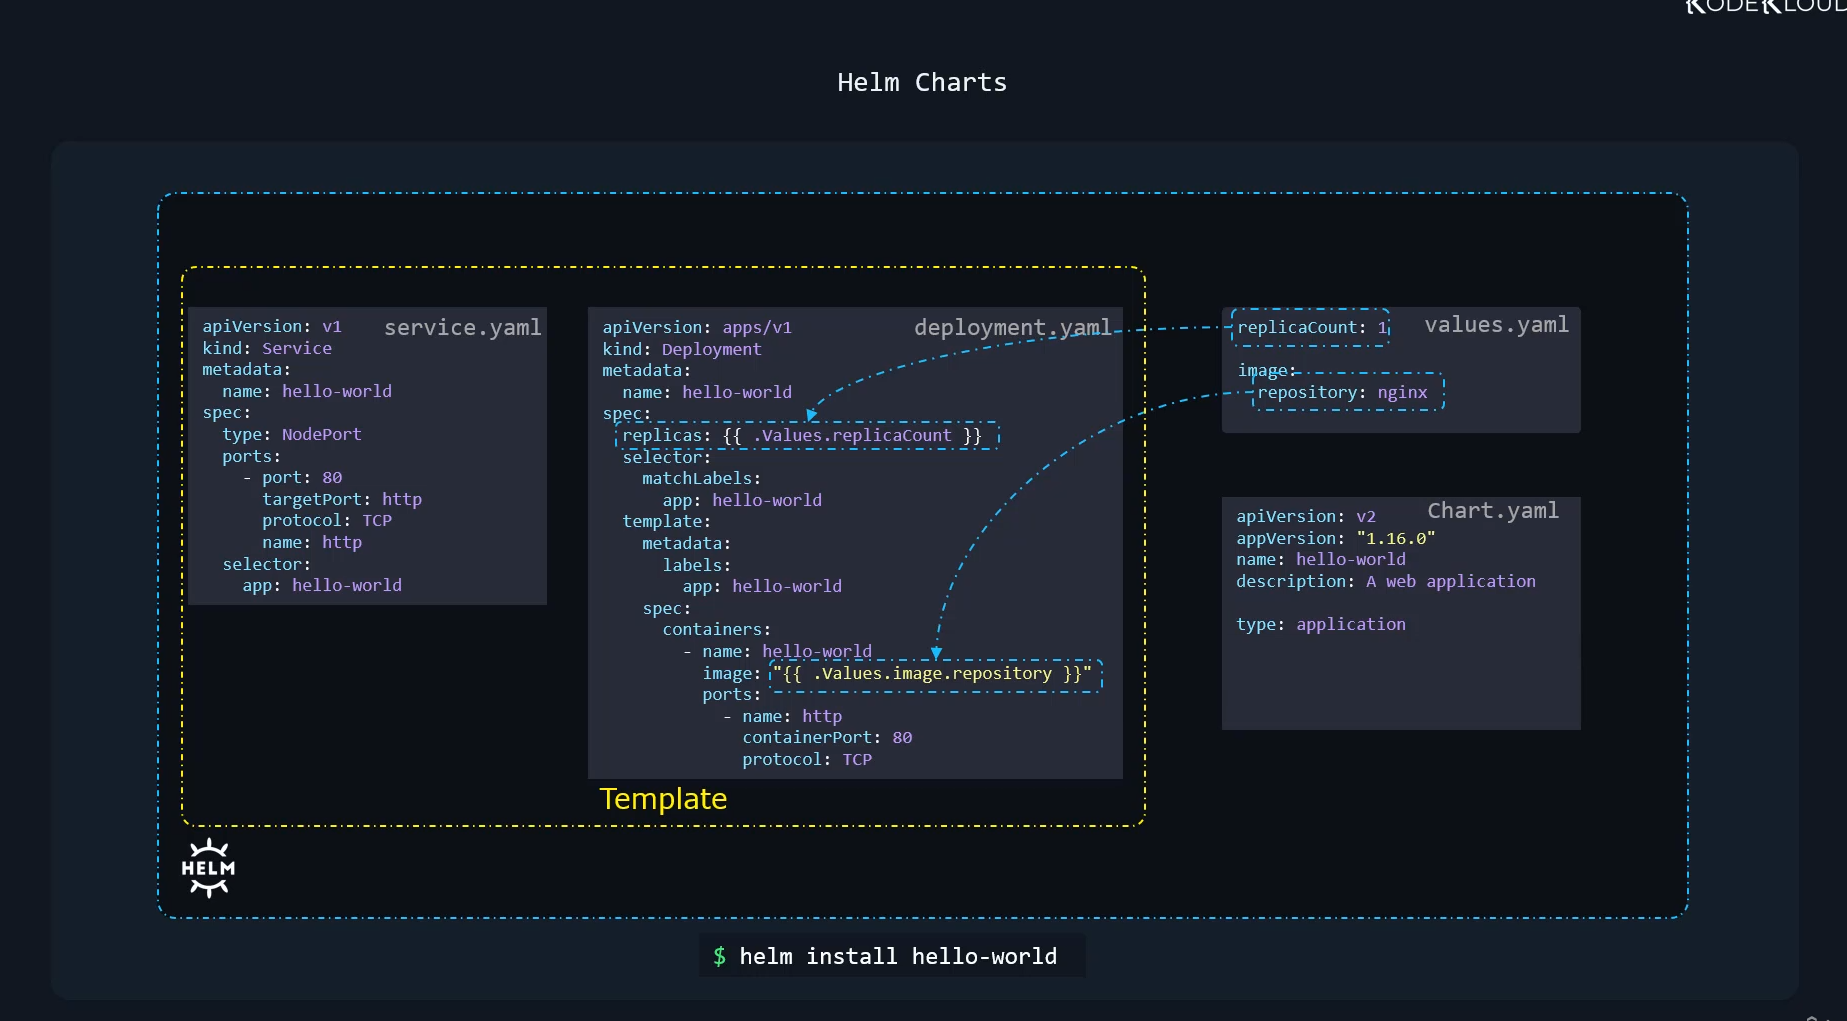 Apart from the values.yaml file,
every chart also has a chart.yaml file.
This contains information about the chart itself,
such as the chart API version,
which could be either V1 or V2.
There’s also an app version, which is used to specify
the version of the application.
And then we have the name of the chart,
a description, type of chart, et cetera.
And these are just a few of the many properties
a chart.yaml file has.
So that’s what we will look at next.
So let’s look at the chart.yaml file
of this WordPress site
as an example to understand it better.
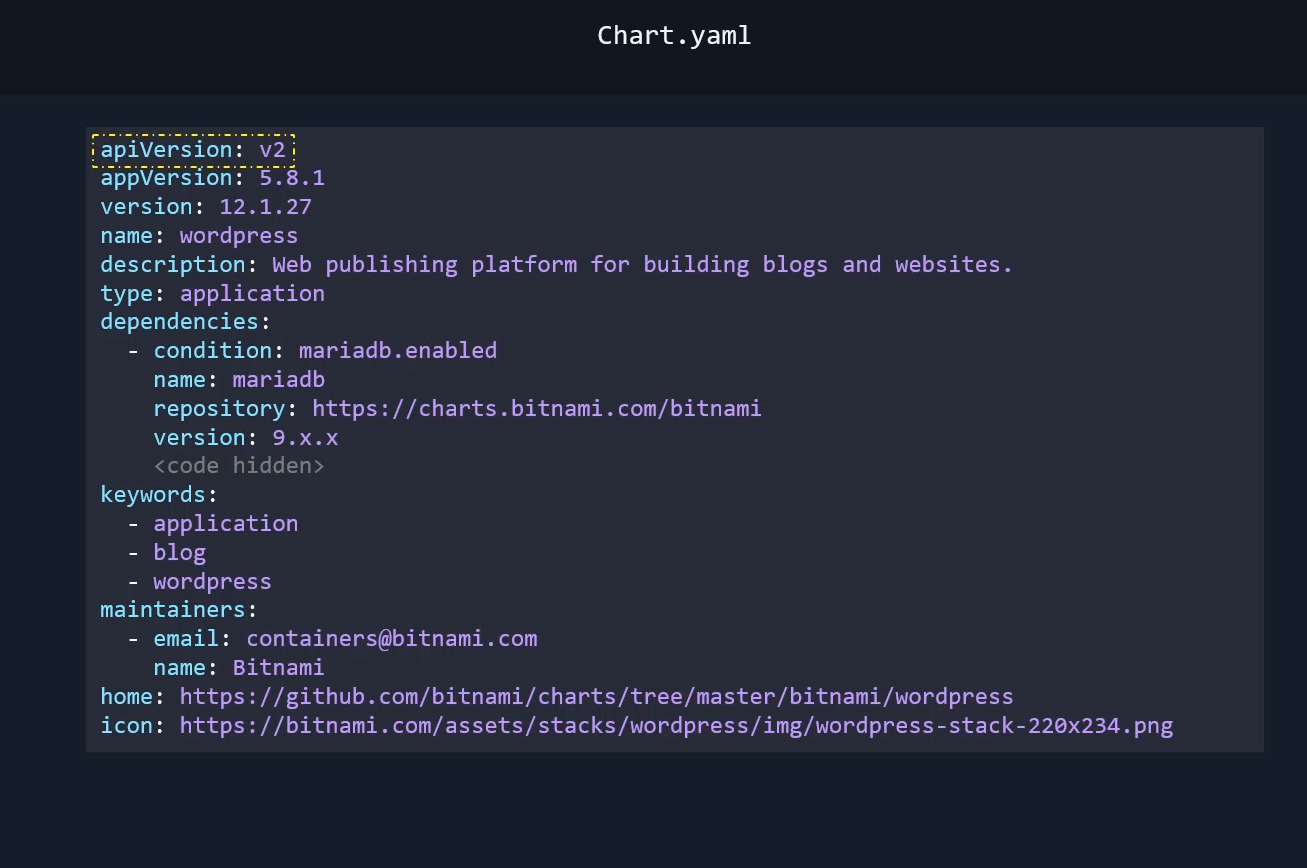 The API version is the API version of the chart.
Now, when Helm 2 was around, this field did not exist.
And when Helm 3 was introduced,
it came with the additional features
that introduced changes in the yaml file,
which were not present earlier.
For example, the dependencies section
and the type fields that you see here
were not available in Helm 2.
So Helm 3 needed a way to differentiate
between charts built in the past
and charts built for Helm 3.
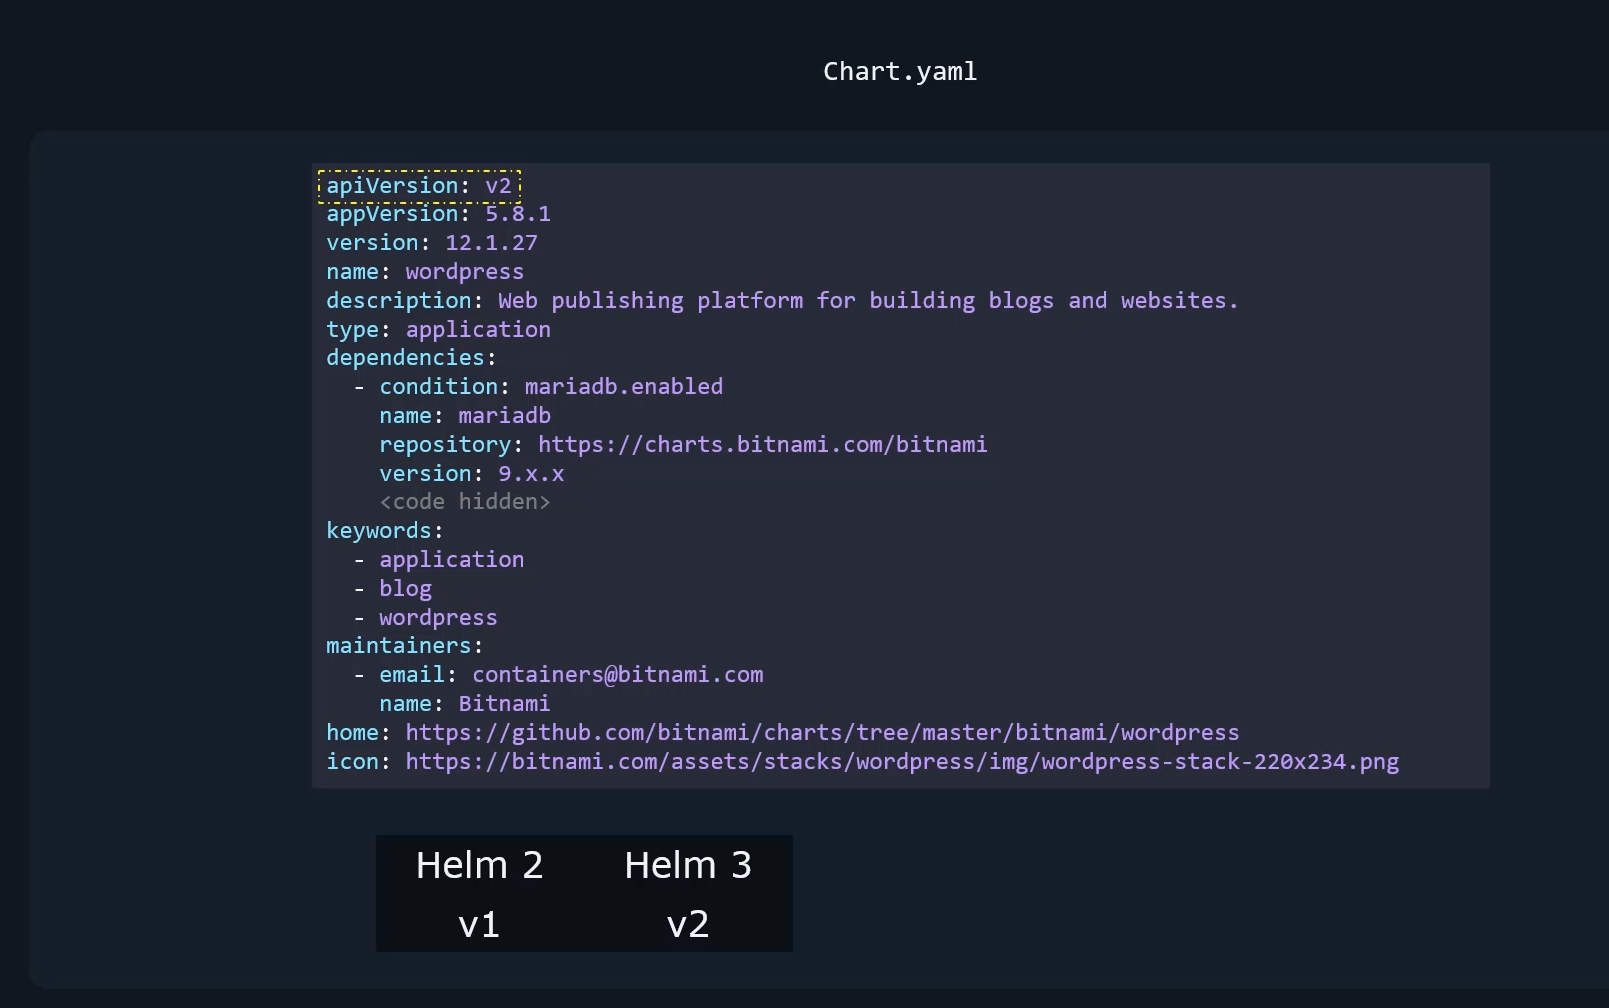 And so this field was first introduced by Helm 3.
With this field, Helm 3 can now differentiate
between old charts built for Helm 2
and new charts built specifically for Helm 3.
So old charts will either not have this value set at all,
or if you build a chart specifically for Helm 2 today,
then it would need to be set to V1.
And all charts built for Helm 3
will have this value set to V2.
So let’s say you build a chart with the API version
set to V2, but use it on Helm 2,
then Helm 2 will not even consider this field,
and will simply ignore any additional fields
that were not only available for Helm 3,
resulting in unexpected results.
So bottom line is
if you are developing a chart going forward,
just make sure that you set this to V2
because you’re most likely going to write charts
for Helm 3.
And if you’re looking at a chart
that does not have this value set,
then it is very likely
that the chart was built for Helm 2.
Okay, so next is the app version.
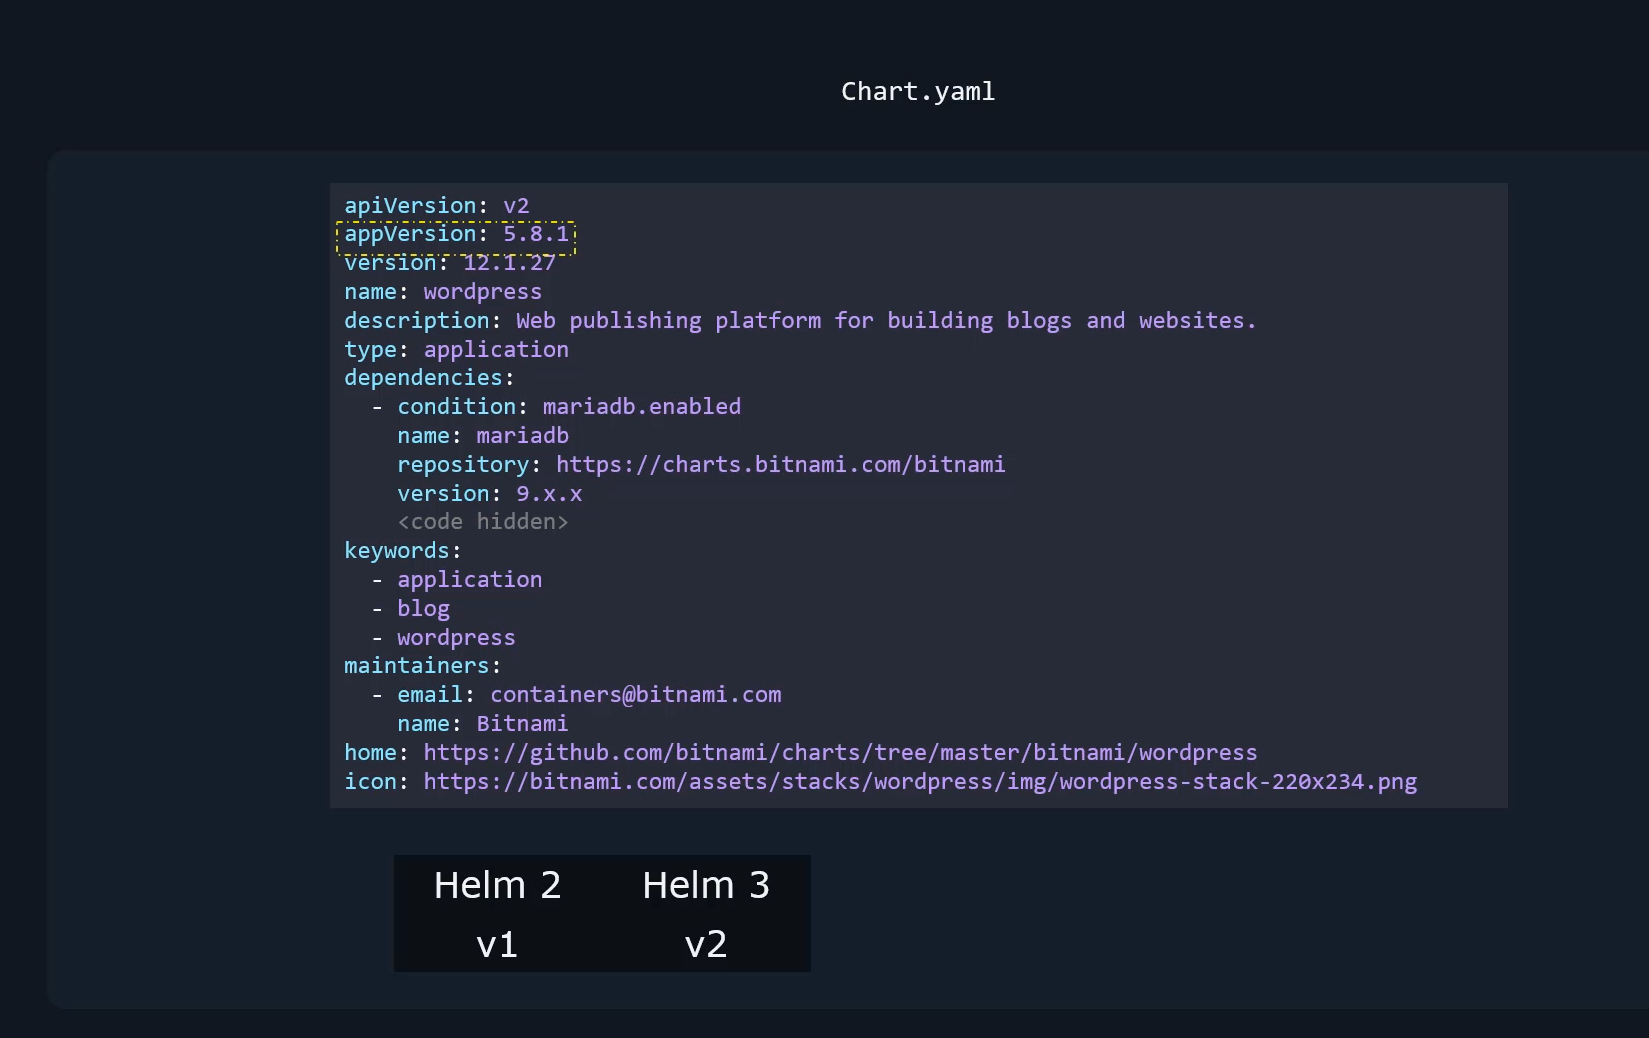 Now the app version is a version of the application
that’s inside of this chart.
So in this case, the application is WordPress.
So this refers to the version of WordPress
that this chart will deploy.
This field is for informational purposes only,
and then there is version,
which is the version of the chart itself.
So every chart must have its own version,
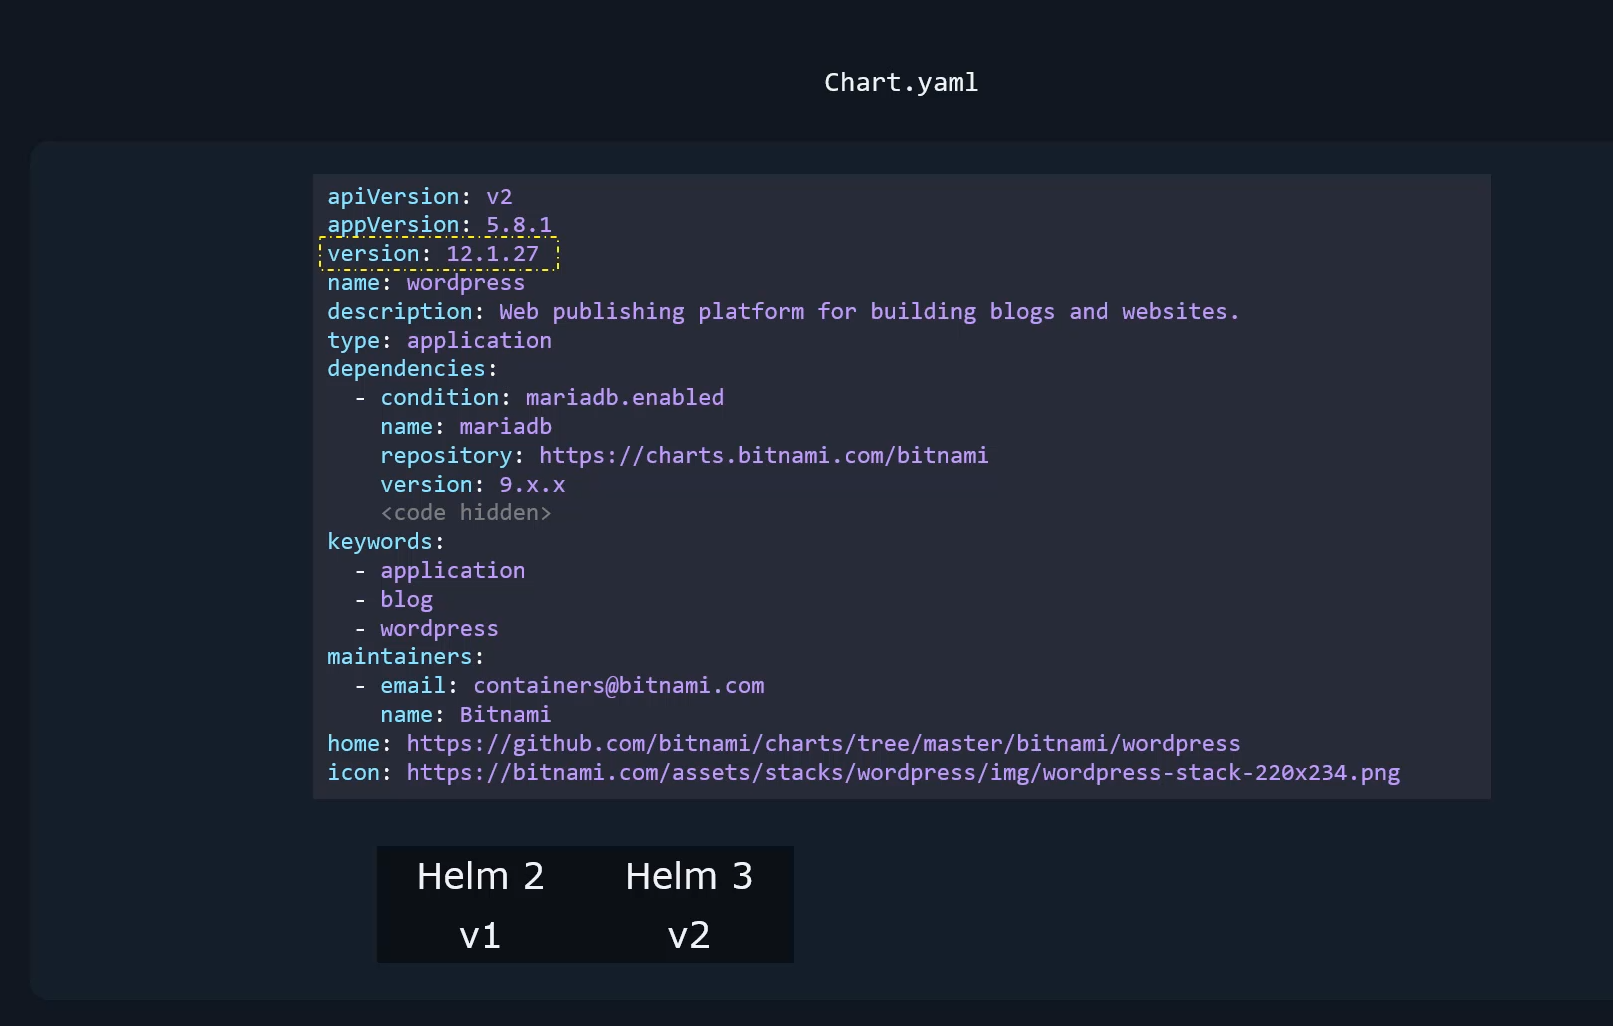 and this is independent of the version of the app
that this chart will deploy.
This helps in tracking changes to the chart itself.
The next is the name of the chart,
which is set to WordPress, followed by a description.
And the next is type.
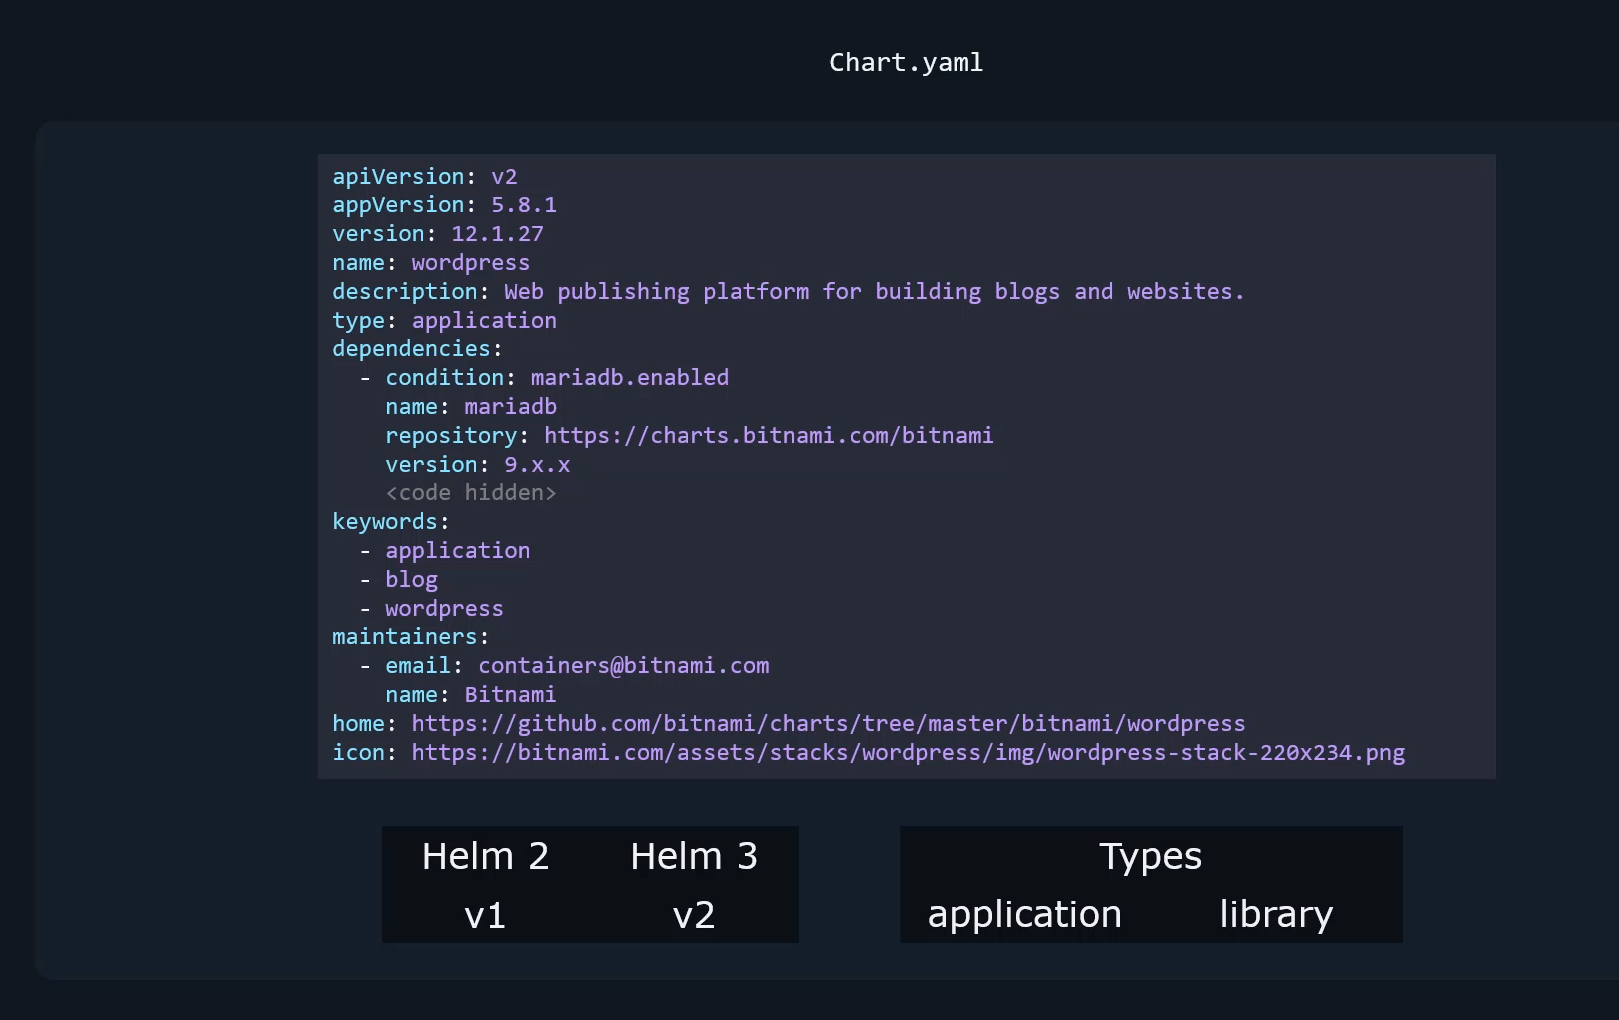 So there are two types of charts,
application and library.
So application is the default type,
which is all the charts
that we create for deploying applications.
And library is the type of chart that provides utilities
that help in building charts.
So we’ll discuss more about that later.
The next are dependencies.
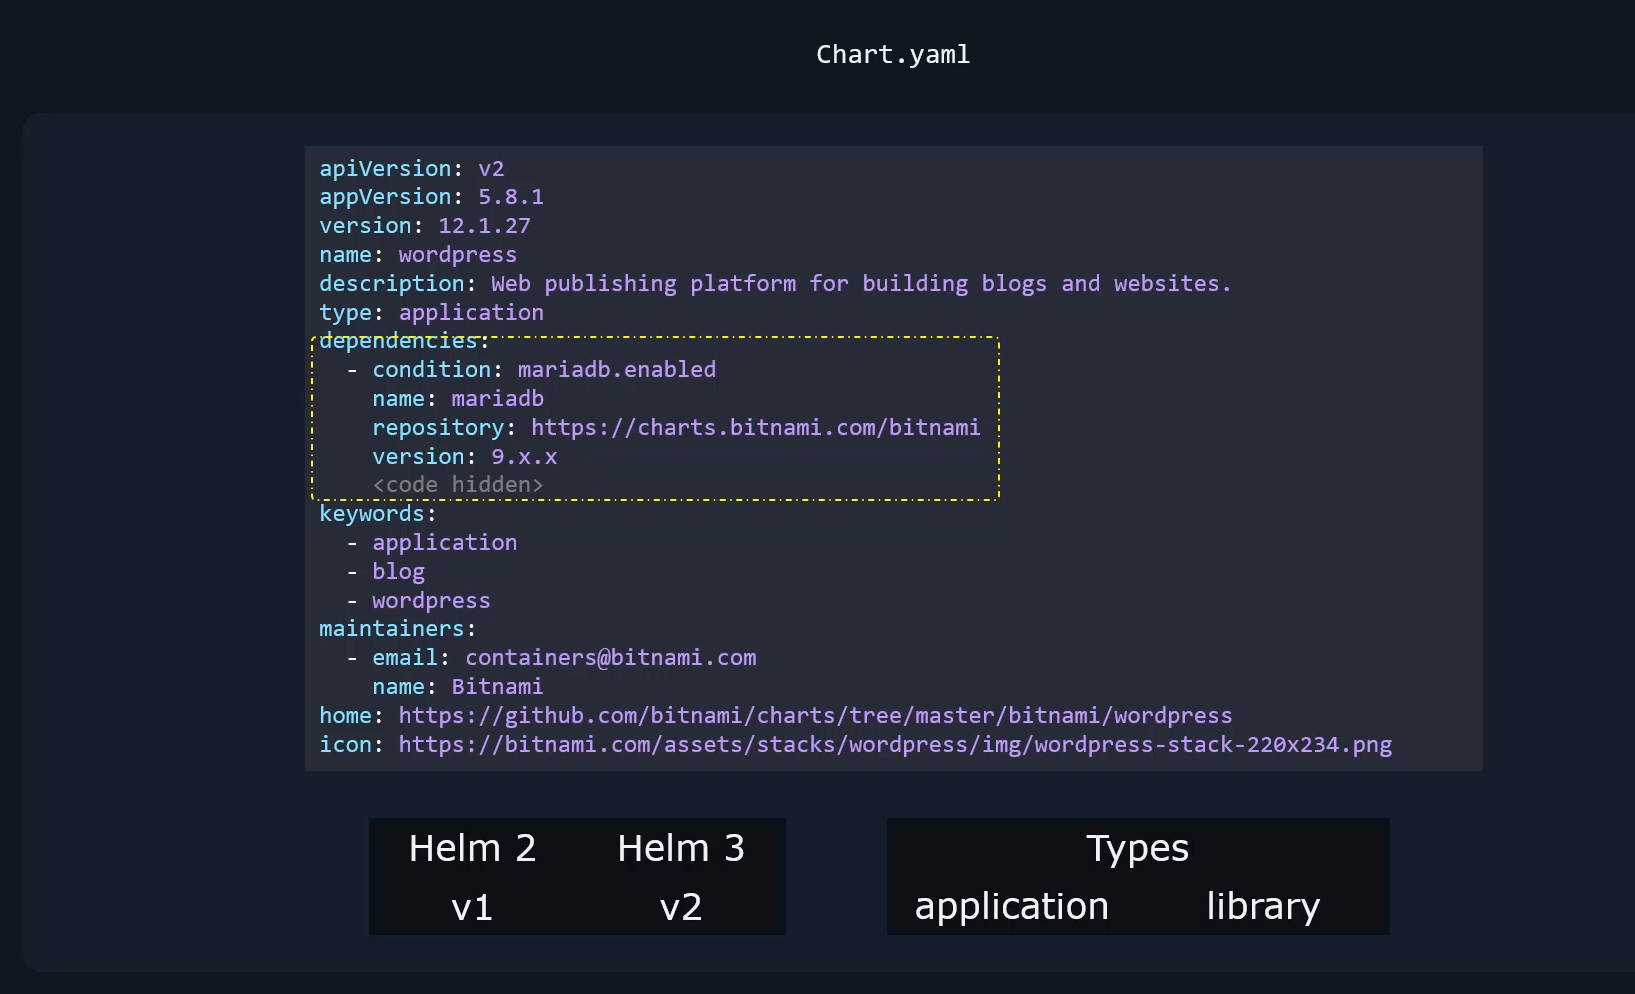 So the WordPress application is a two tier application
that has the WordPress server and a database server.
The database in this example is a MariaDB database.
So MariaDB has its own Helm charts.
So we could simply add it
as a dependency to our application.
This way we don’t have to merge the manifest files
of MariaDB or any other database
into this particular chart.
And then there is a list
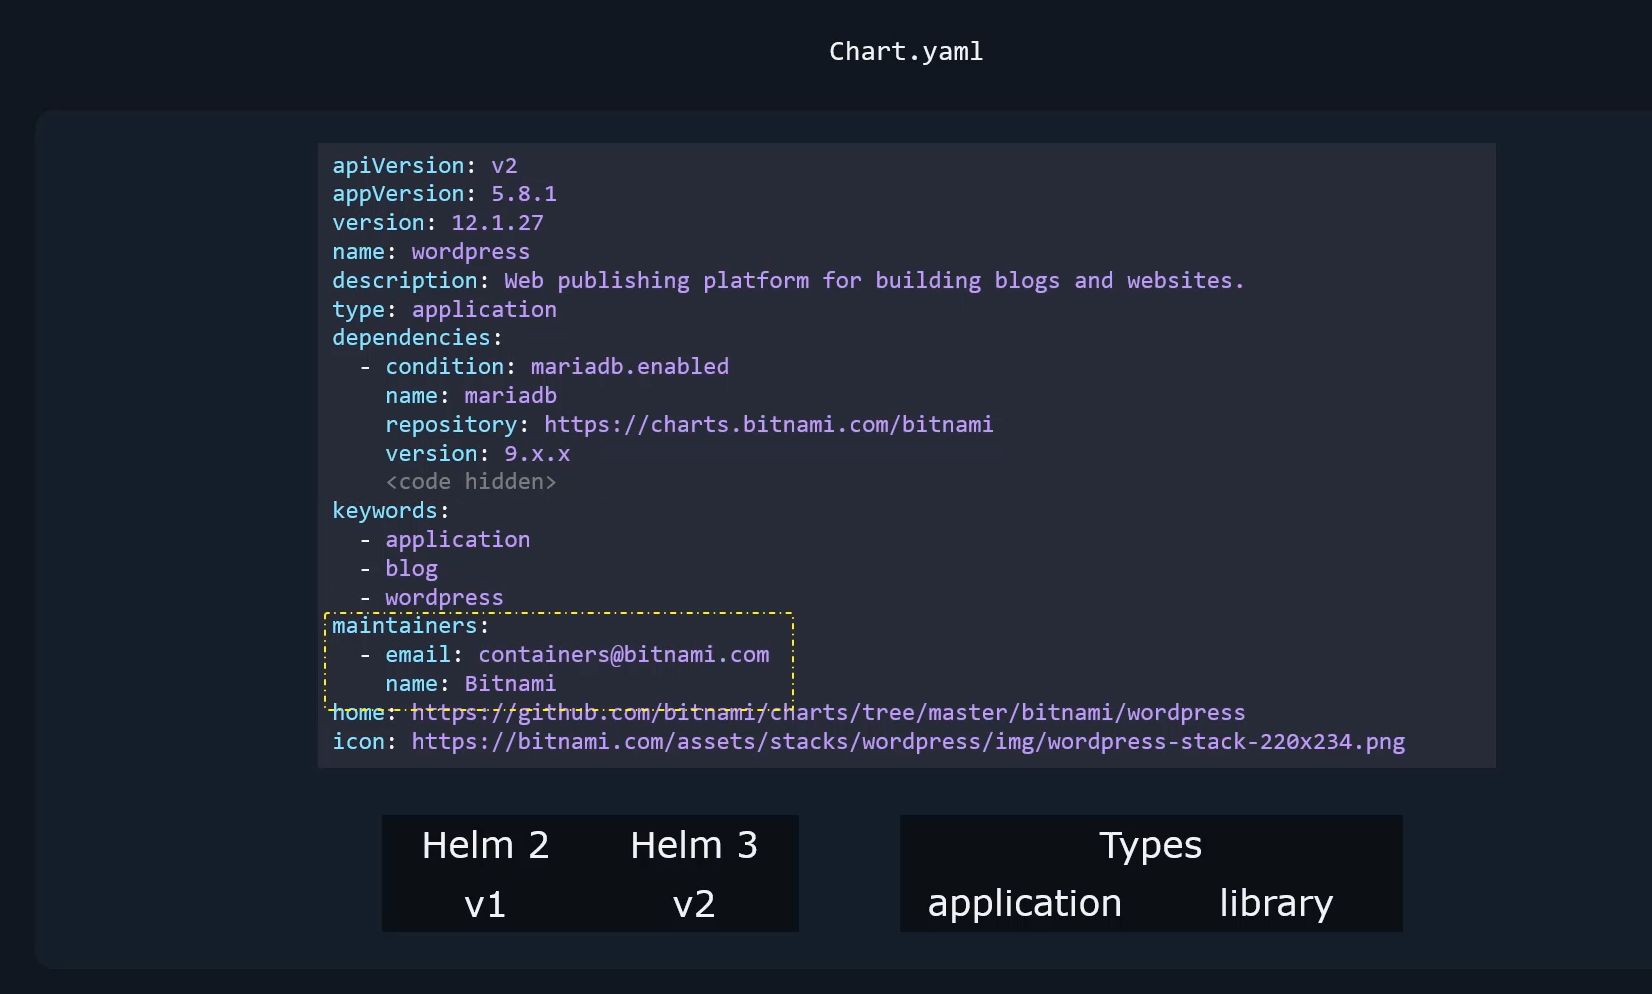 of keywords associated with this project.
This can be helpful when searching for this chart
in a public chart repository.
And then there is maintainers section,
which is information about the maintainers.
And there are optional fields like Home
and Icon that are used to share a URL
of the homepage of the project and a URL to an icon.
So a chart directory has the following structure.
It has a templates directory that has the template files
that we just talked about.
It also has the values.yaml
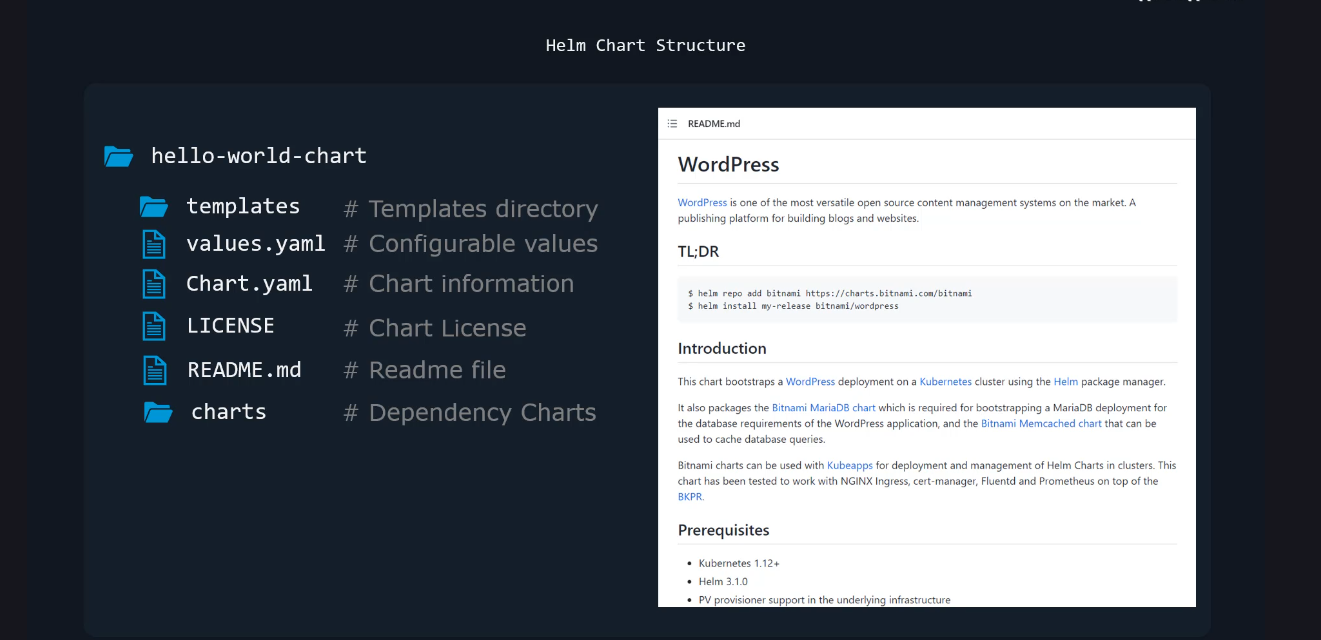
and the chart.yaml file we just talked about.
And apart from these, there may also be a license file
that has the chart license information,
a readme file that has information about the chart
in a human readable form.
And there could also be a charts directory
that has other charts that this chart is dependent upon.
And we will talk about chart dependency
later in this course.