Horizontal Pod Autoscaler (HPA)
So, I’m a Kubernetes administrator
and I’m sitting on my machine looking at a cluster,
and I’m tasked to make sure
that there is always sufficient workload
to support demand for this application.
From a deployment configuration perspective,
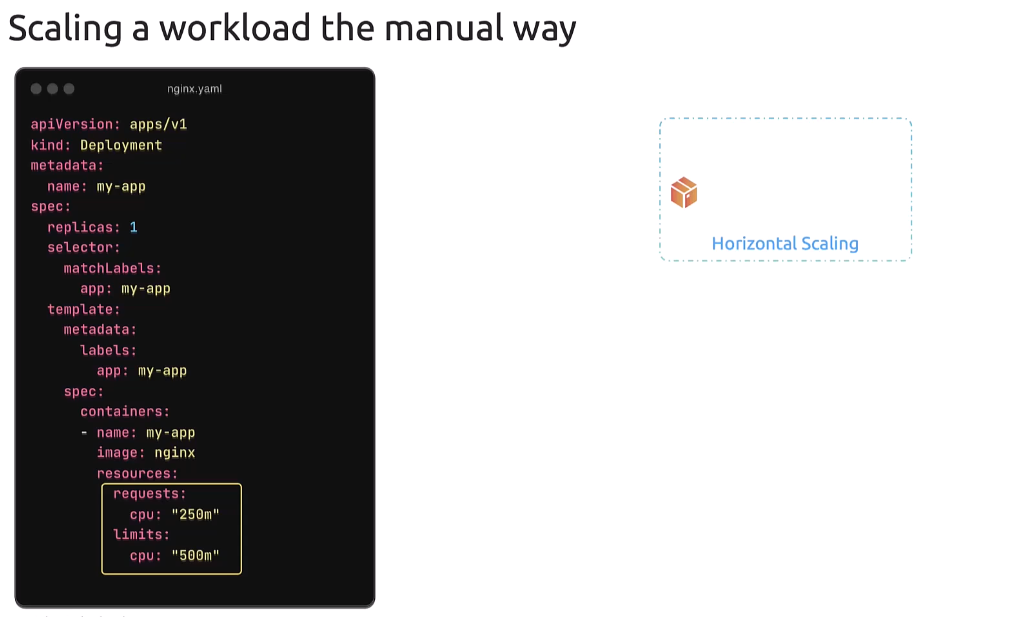 I see this pod requests 250 milli CPU
and has a limit of 500 millicores of CPU.
This means that 500 millicores is the max the CPU it gets
after which it doesn’t get anymore.
And the capacity that a single pod can handle
is 500 millicores of CPU.
So, I would run the kubectl top pod command
and monitor the resource consumption of the pod
if it had to do it manually.
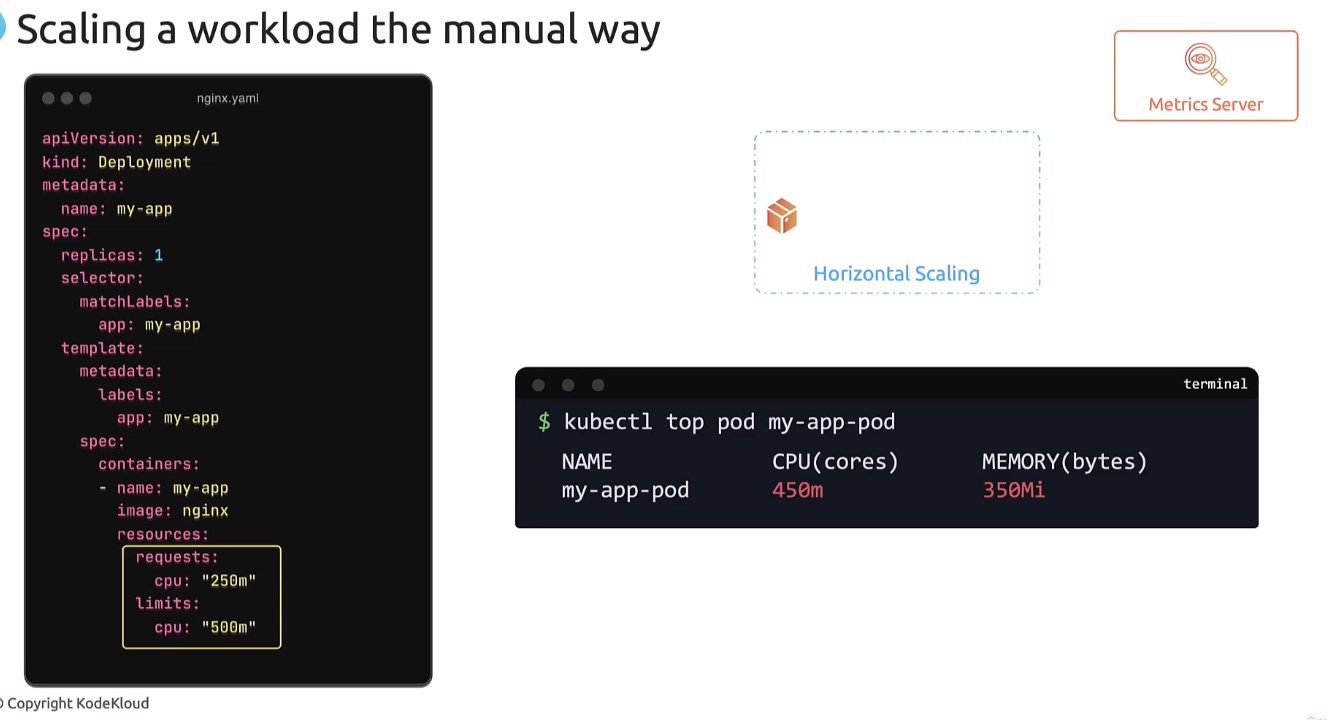 Now remember that you must have the metrics server
running on the cluster to be able to monitor
the resource usage like this.
Now, when it reaches the threshold of 450 millicores
or whatever it is that I’ve defined as the threshold,
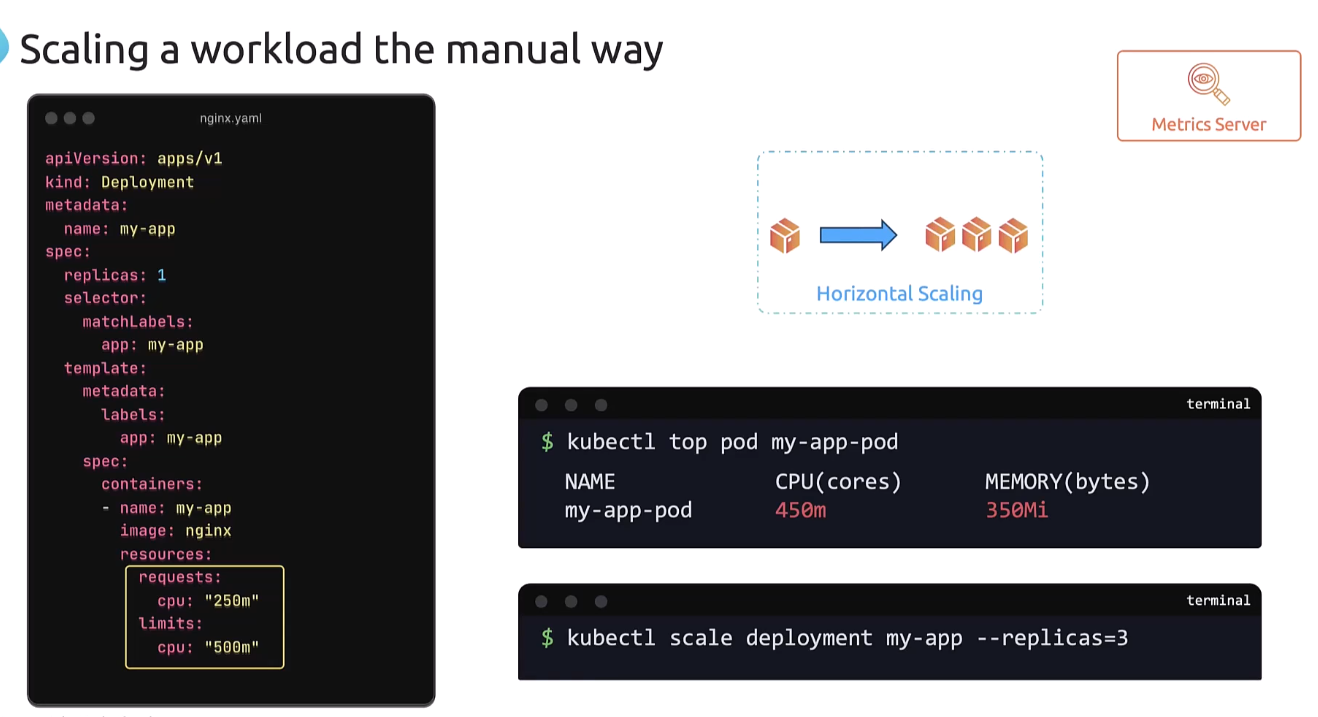 or close to that, I would run the kubectl scale command
to scale the deployment to add additional pods.
So, that’s the manual way to scale a workload.
The problems with this approach
is that I have to sit in front of my computer
and continuously monitor resource usage.
I need to manually run commands to scale up and down.
And if there’s a sudden traffic spike
and I wanna break or something,
I may not be able to react fast enough
to support the spike in the application or in the traffic.
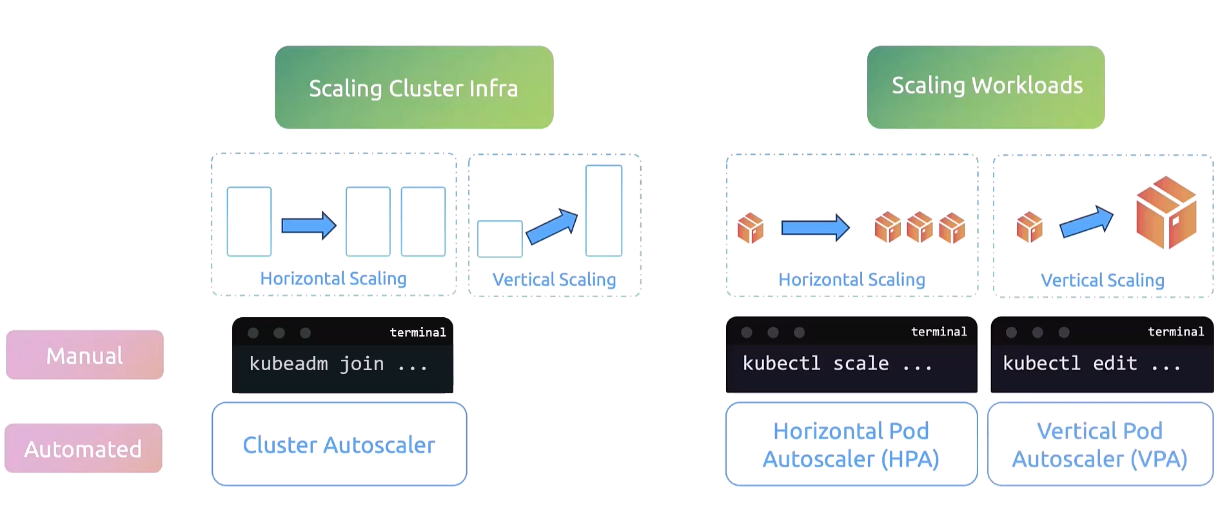
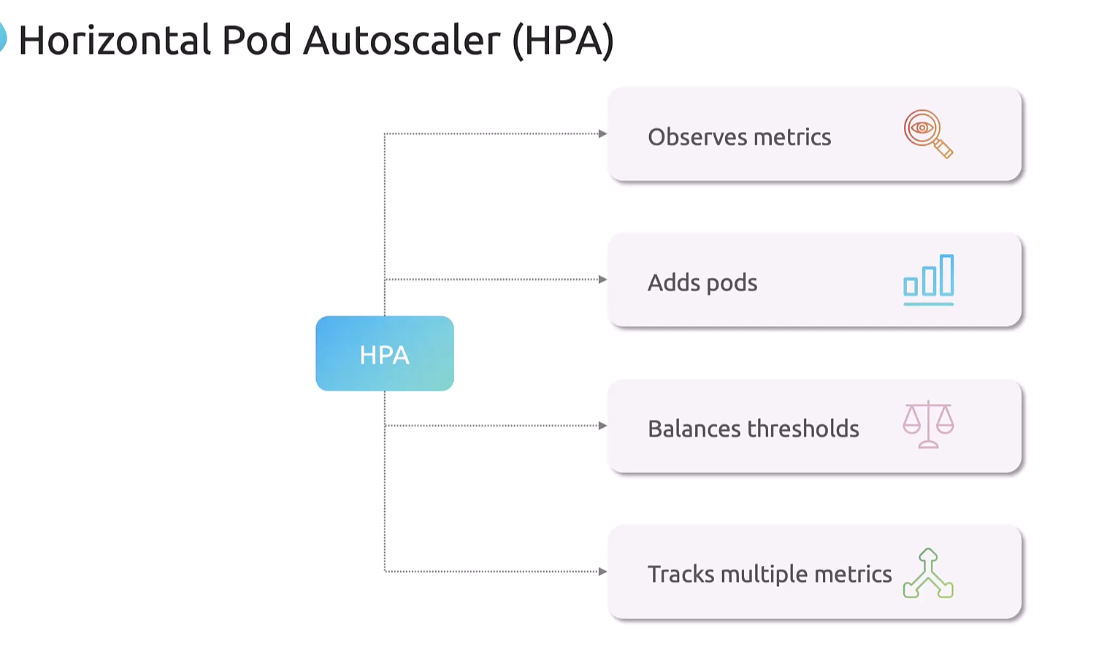 So to solve this, we use the Horizontal Pod Autoscaler.
So, the Horizontal Pod Autoscaler continuously monitors
the metrics as we did manually using the top command.
It then automatically increases or decreases
the number of pods in a deployment stateful set
or replica set based on the CPU memory, or custom metrics.
And if the CPU memory or memory usage goes too high,
HPA creates more pods to handle that.
And if it drops,
it removes the extra pods to save resources.
And this balances the thresholds.
And note that it can also track
multiple different types of metrics,
which we’ll refer to in a few minutes.
So, let’s see this in action.
For the given NGINX deployment,
we can configure a Horizontal Pod Autoscaler
by running the kubectl autoscale command
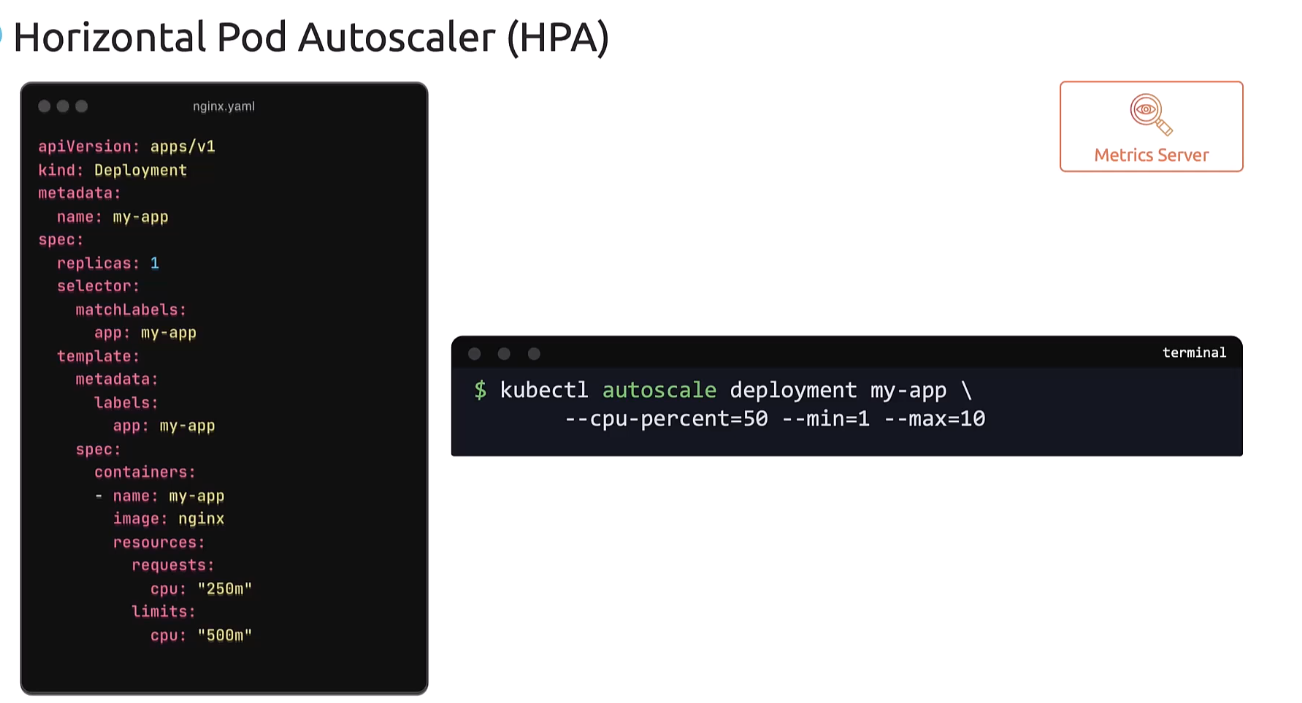 targeting the deployment my-app,
and specifying a CPU threshold of 50%
with a minimum of 1 and maximum of 10 pods.
So when this command is run,
Kubernetes creates a Horizontal Pod Autoscaler
for this deployment that first reads the limits
configured on the pod,
and then learns that it’s set to 500 millicore.
It then continuously pulls the metric server
to monitor the usage, and when the usage goes beyond 50%,
it modifies the number of replicas to scale up or down
depending on the usage.
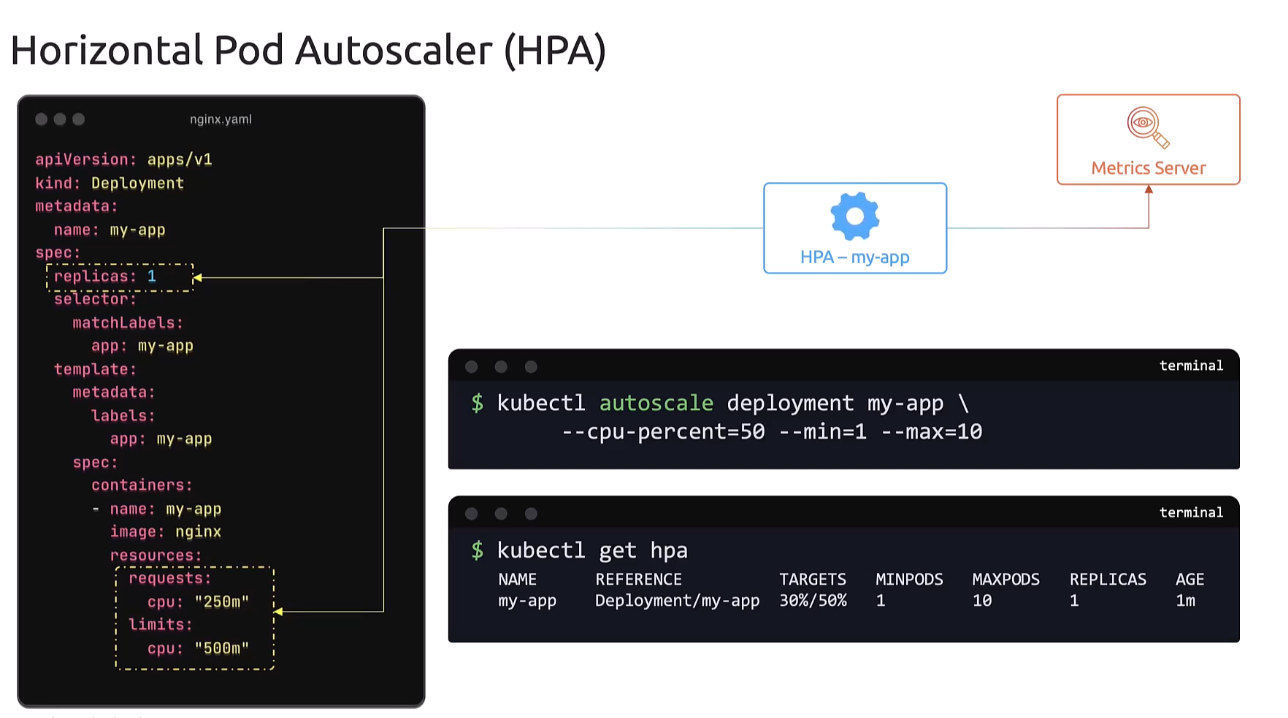 So, to view the status of the created HPA,
run the kubectl get hpa command,
and it lists the current HPA.
The targets column shows the current CPU usage
versus the threshold we have set,
and the minimum and maximum,
and the current count of replicas.
So, it would never go beyond the maximum
that we have specified when scaling up
and it would not go beyond the minimum
that we have specified when scaling down.
And when you no longer need the HPA,
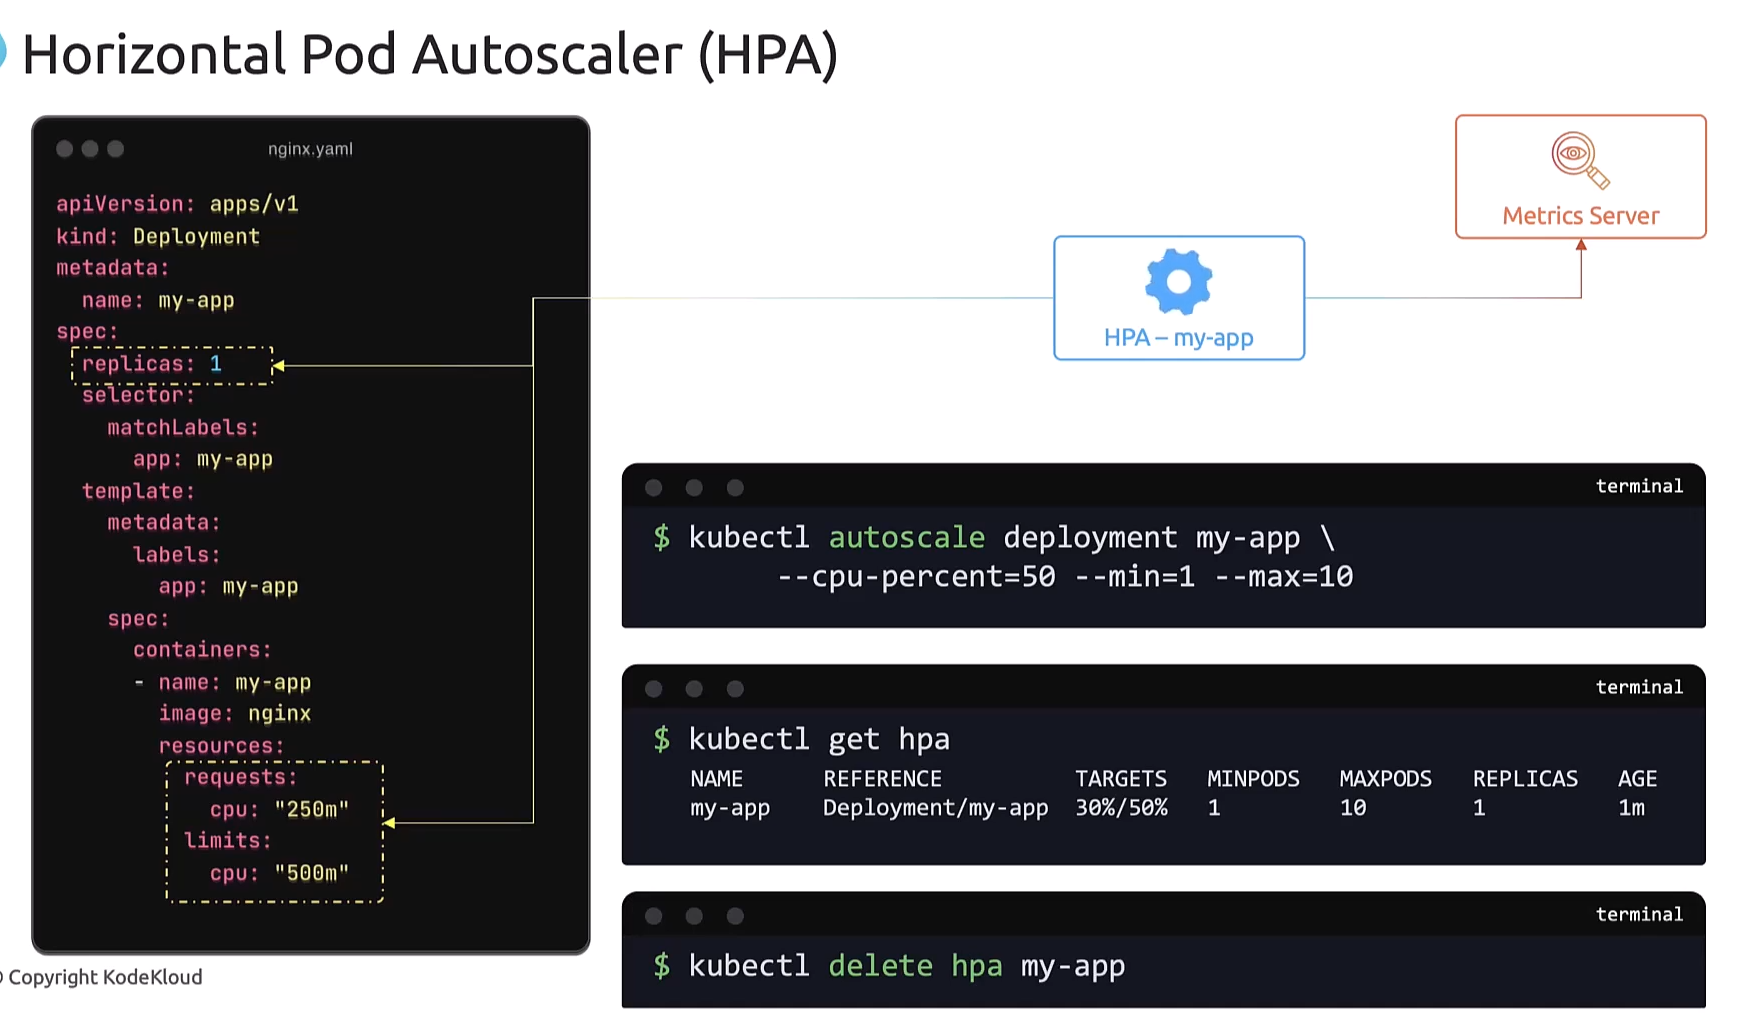 you can delete it using the kubectl delete hpa command.
Now, that was the imperative approach to creating an HPA.
There’s also a declarative approach.
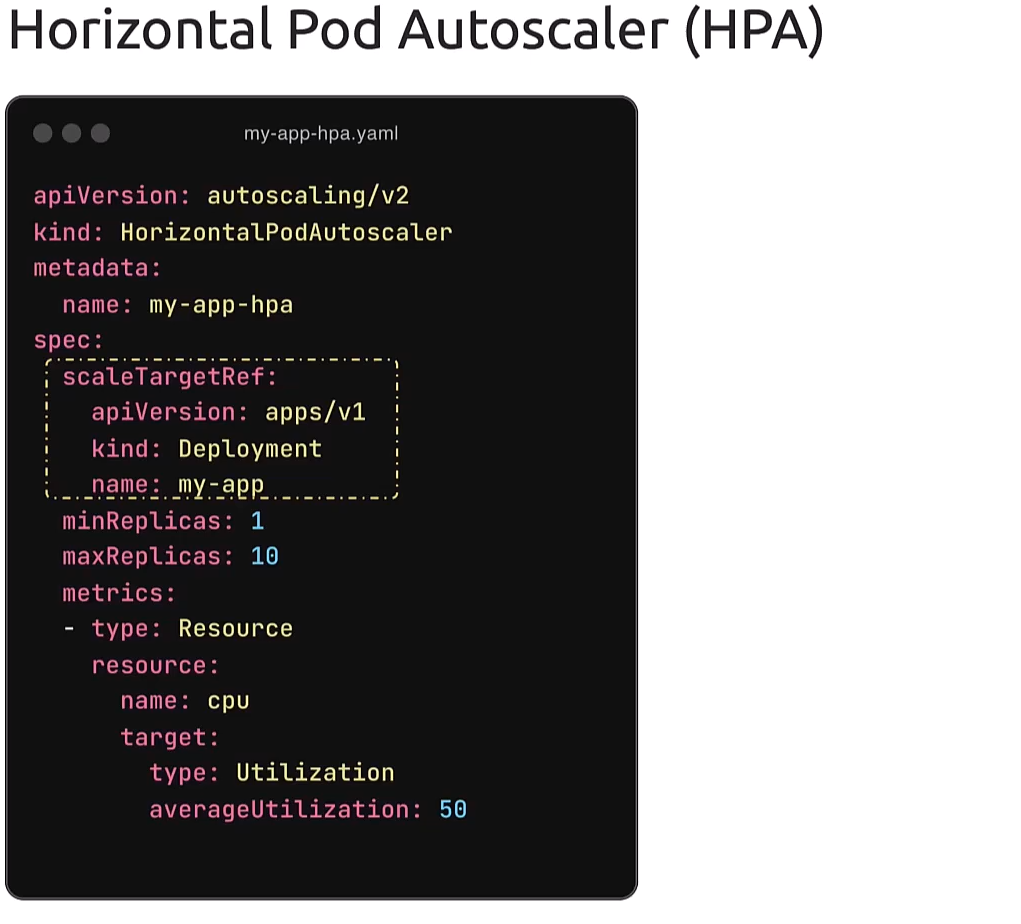 So, create an HPA definition file with the API version
set to autoscaling/v2.
Kind is set to HorizontalPodAutoscaler.
The name is set to my-app-hpa.
And then we have the scaleTargetRef.
This is the target resource we want the HPA to monitor.
That’s the deployment named my-app.
We also have the min and maxReplicas defined.
And then we have configured the metrics
and resources to monitor.
In this case, the resource being CPU
and target utilization being 50%.
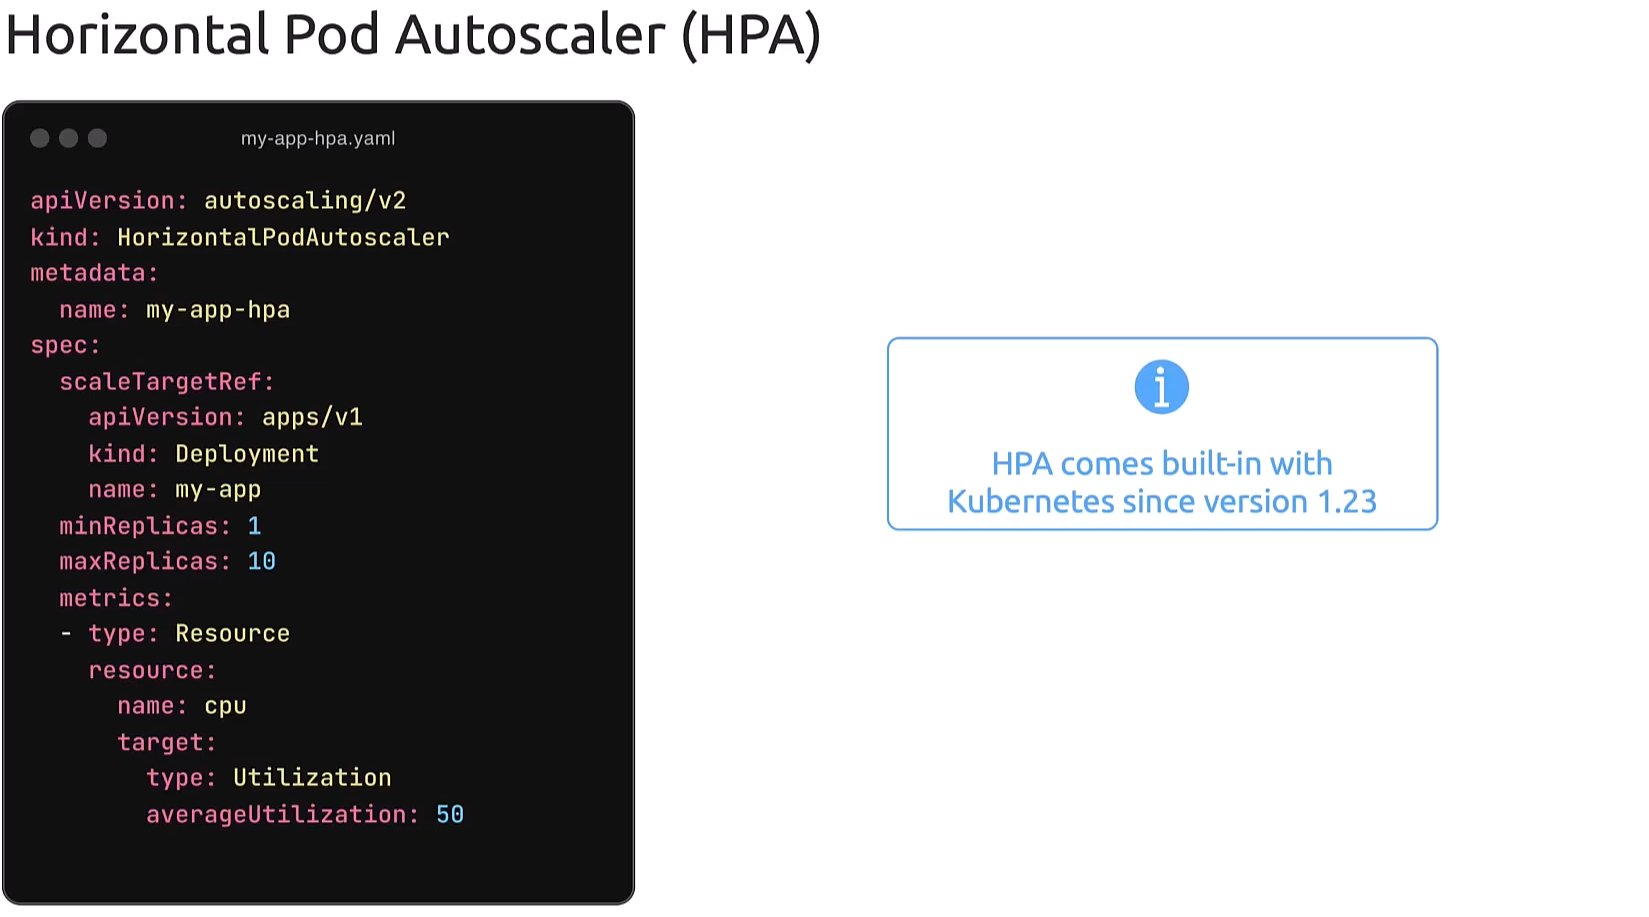 Now, note that HPA comes built in
with Kubernetes since version 1.23.
So, there is no separate installation procedures required.
Note that it relies on metrics server,
so that is a prerequisite.
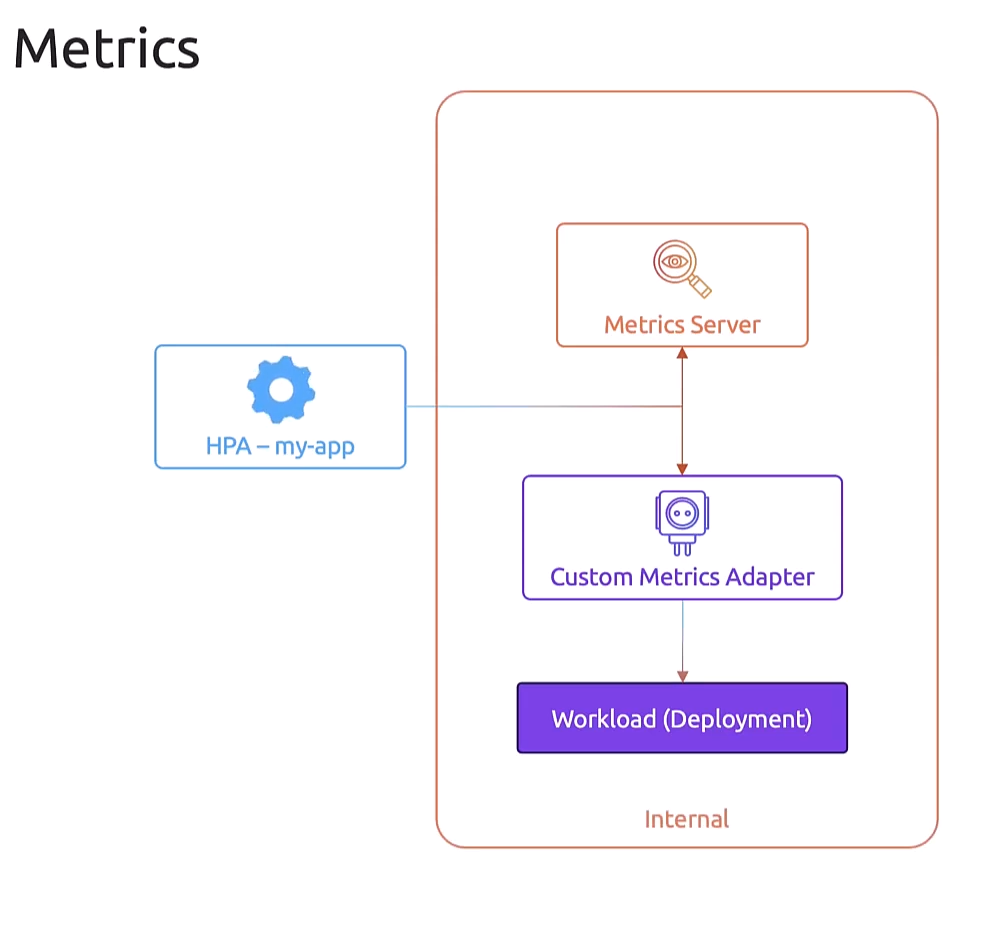 So, talking about metrics server,
we spoke about the metrics server that HPA depends on
to get current resource utilization numbers.
Now what we have been referring to
is the internal metrics server,
but there are also other resources that we can refer to,
such as a Custom Metrics Adapter
that can retrieve information from other internal sources
like a workload deployed in a cluster.
However, these are still internal sources.
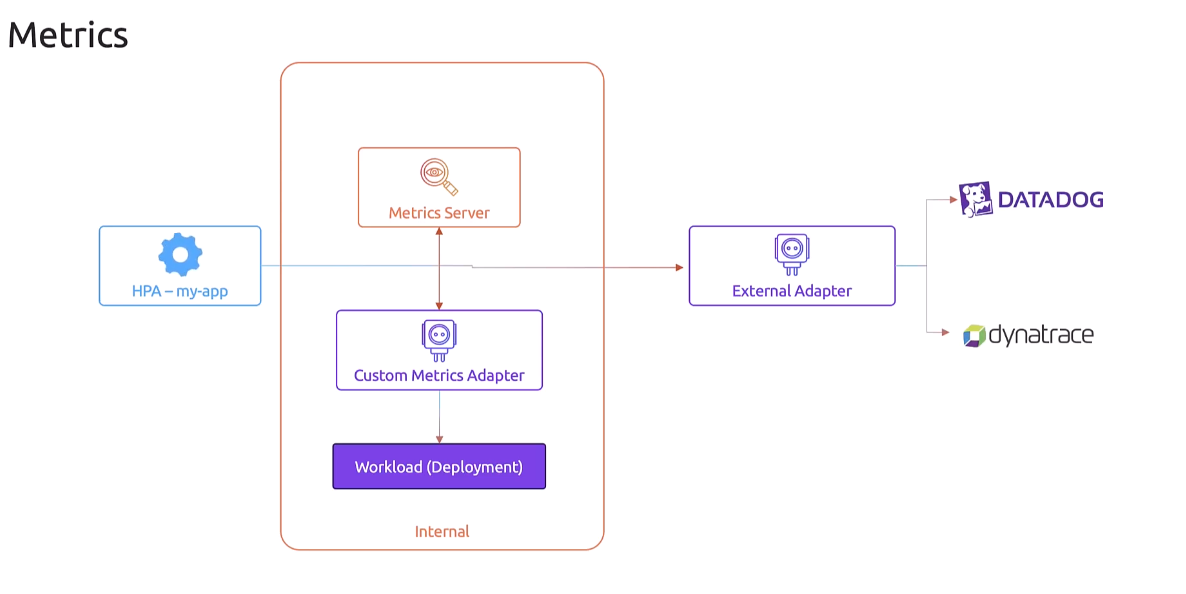 We can also refer to external sources
such as tools or other instances
that are outside of the Kubernetes cluster,
such as a Datadog or Dynatrace instance
using an external adapter.
However, these are beyond the scope of this course.
So, more details and labs about these are available
in our Kubernetes Autoscaling course.
To keep the scope just enough for the exam,
this is all that we’ll discuss about HPA for now.
Well, thank you so much for watching.
Head over to the labs and I’ll see you in the next one.