Helm has multiple components we’ll be working with, so let’s take a look at its general structure, concepts, and the pieces we’ll be working with.
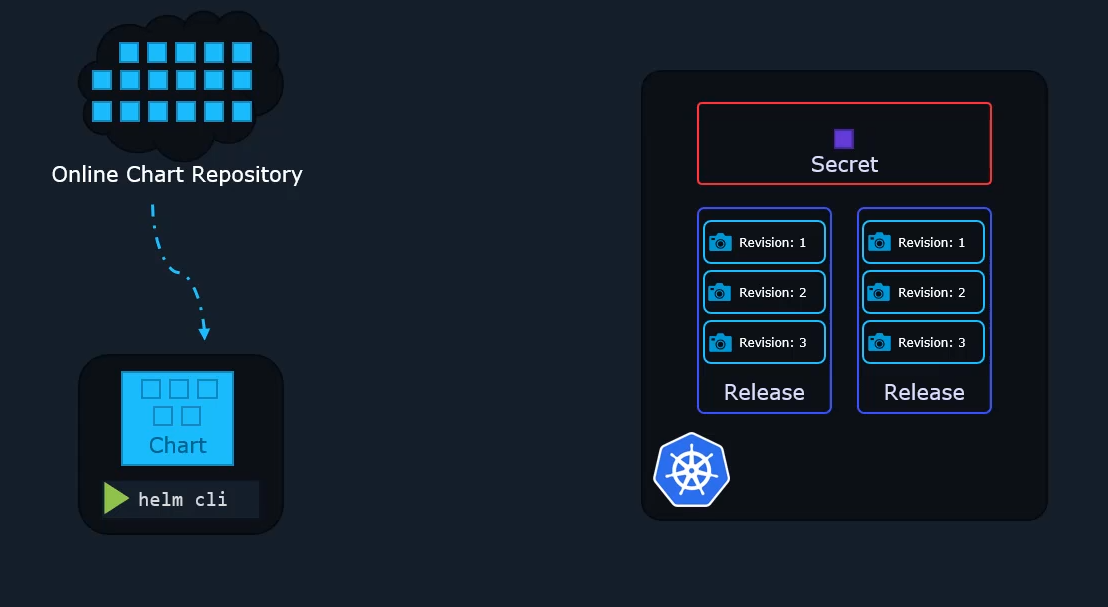
So we have the Helm command line utility on our local system that we will be using to perform Helm actions such as installing a chart, upgrading, rollback, et cetera.
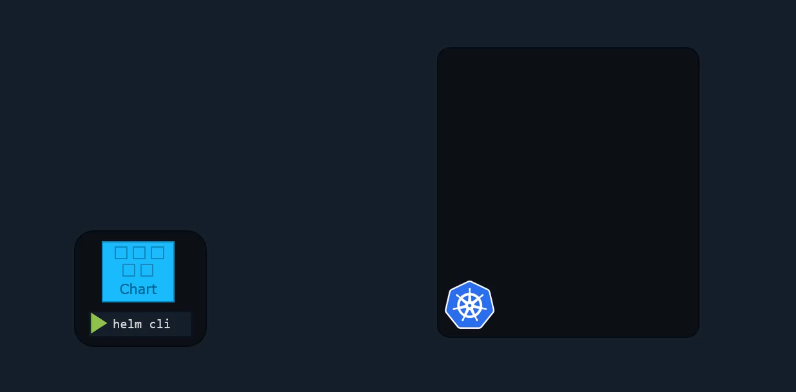 Charts are a collection of files, and they contain all the instructions that Helm needs to know to be able to create the collection of objects that you need in your Kubernetes cluster.
By using charts and adding the objects according to these specific instructions in the charts, Helm, in a way, installs applications into your cluster.
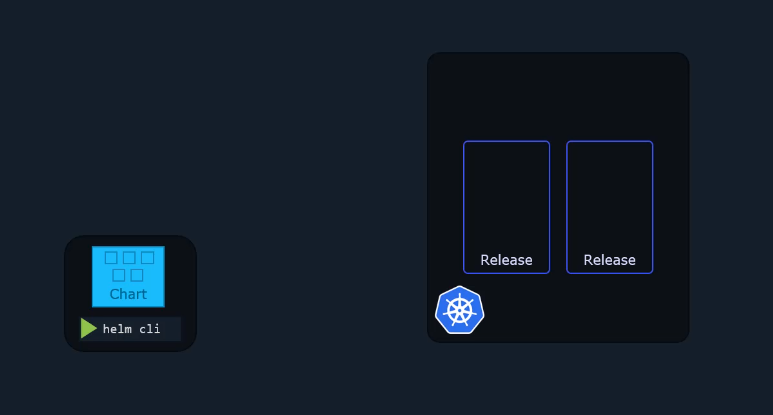 When a chart is applied to your cluster, a release is created. A release is a single installation of an application using a Helm chart.
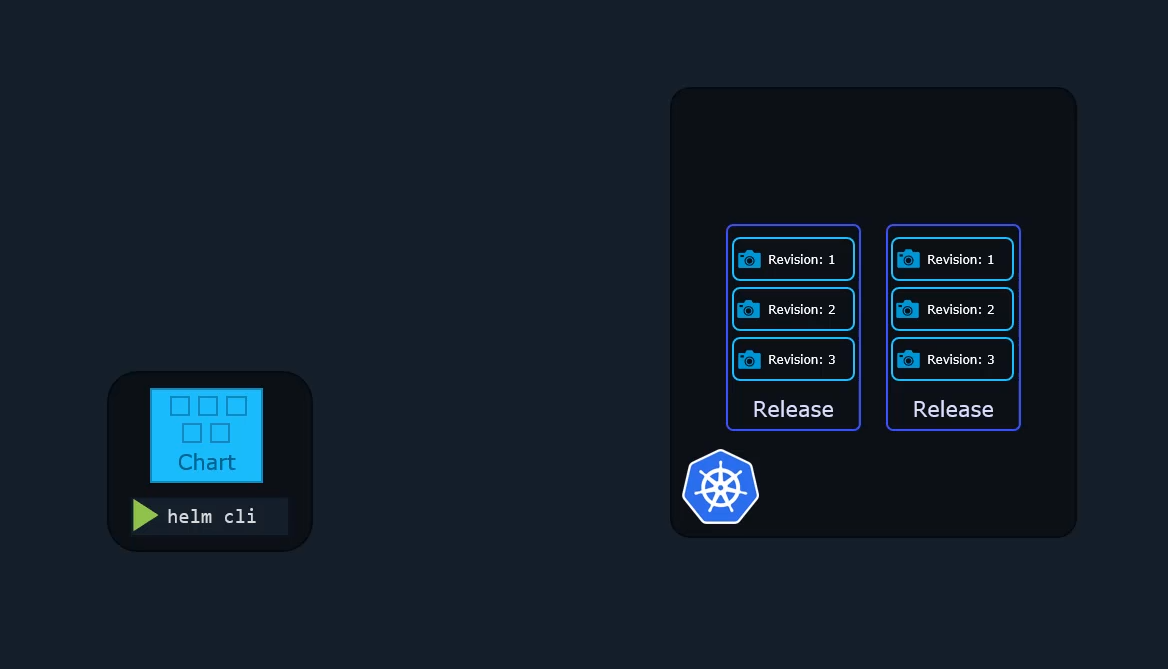 Within each release, you can have multiple revisions, and each revision is like a snapshot of the application.
Every time a change is made to the applications, such as an upgrade of the image or change of replicas or configuration objects, a new revision is created.
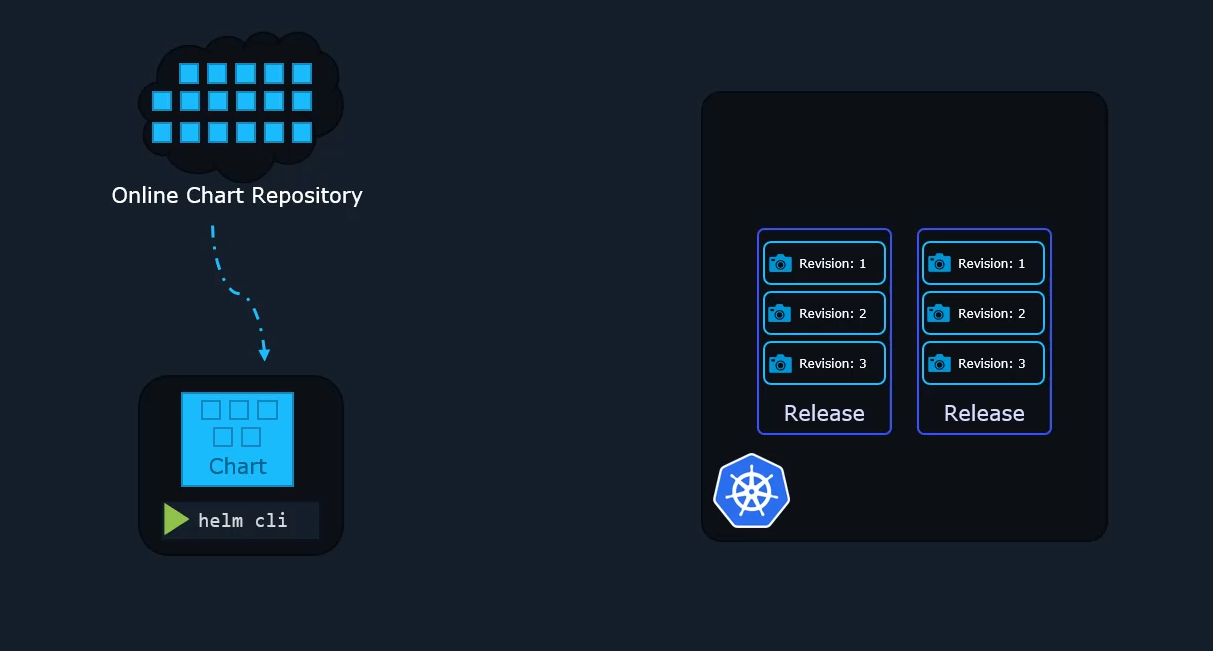 Now, just like how we can find all kinds of images on Docker hub or Vagrant boxes on the Vagrant Cloud,
if you’re familiar with that, you know, we can find Helm charts in a public repository. We can easily download publicly available charts for various applications, and these are readily available and we can use them to deploy applications on our cluster.
And finally, to keep track of what it did in our cluster, such as the releases that it installed, the charts used, revision states and so on, Helm will need a place to save this data.
This data is known as metadata, and that is data about data.
Now, it wouldn’t be too useful if Helm would save this on our local computer.
If another person would need to work with our releases through Helm, they would need a copy of this data. So instead, Helm does the smart thing and saves this metadata directly in our Kubernetes cluster as Kubernetes secrets.
This way, the data survives,
and as long as the Kubernetes cluster survives
and everyone from our team can access it,
so they can do Helm upgrades
or whatever it is that they want to do.
So Helm will always know about everything it did
in this cluster and will be able to keep track
of every action, every step of the way,
since it always has its metadata available.
Now, let’s look at each of these in a bit more detail.
Charts are a collection of files,
and they contain all the instructions that Helm needs
to know to be able to create the collection of objects
that you need in your Kubernetes cluster.
By using these charts and adding the objects
according to that specific instructions,
is how, as we discussed,
Helm installs applications into your cluster.
Now, I’ll be using two applications throughout this course
to explain concepts.
First is a simple Hello World application,
which is a simple NGINX-based web server
and a service to expose it.
And the other would be a WordPress site,
which is slightly more complex.
Now, the simple web server will help you understand
the concepts in the simplest form.
The WordPress example will help you understand
its real life usage.
For example, in this simple Hello World application,
we have two objects, a deployment and a service.
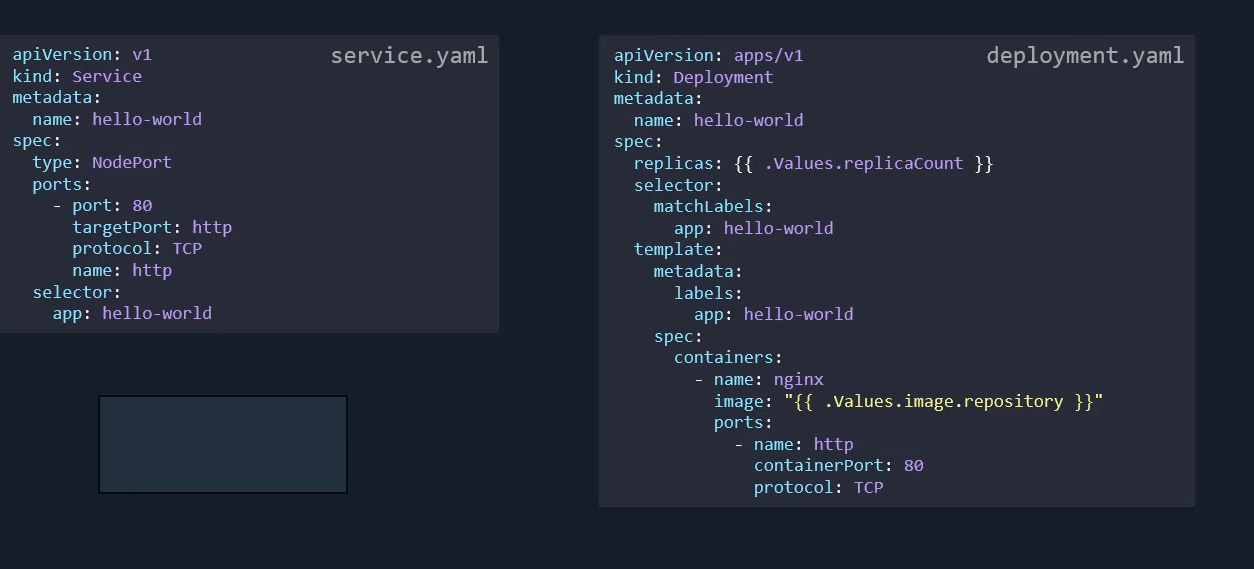
And most of these you should be able to relate to what you learned in the Kubernetes course. It’s a standard deployment object that deploys pods of an image and a service that exposes it as a node port service, for instance.
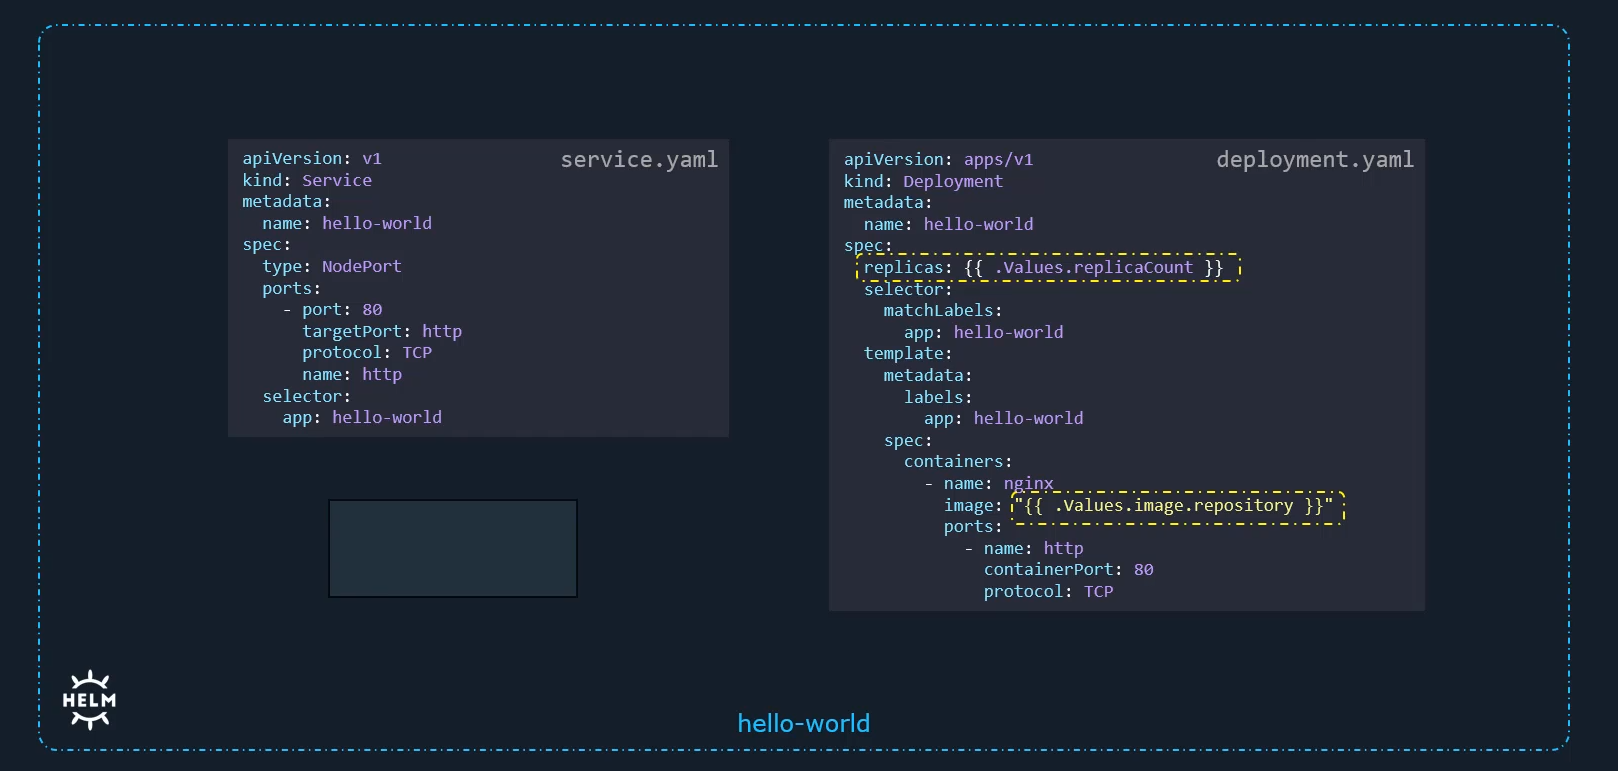 However, you might notice the image name and replicas are specified in a different form. This is called templating. The values that go here are part of another file called as the values.yaml file.
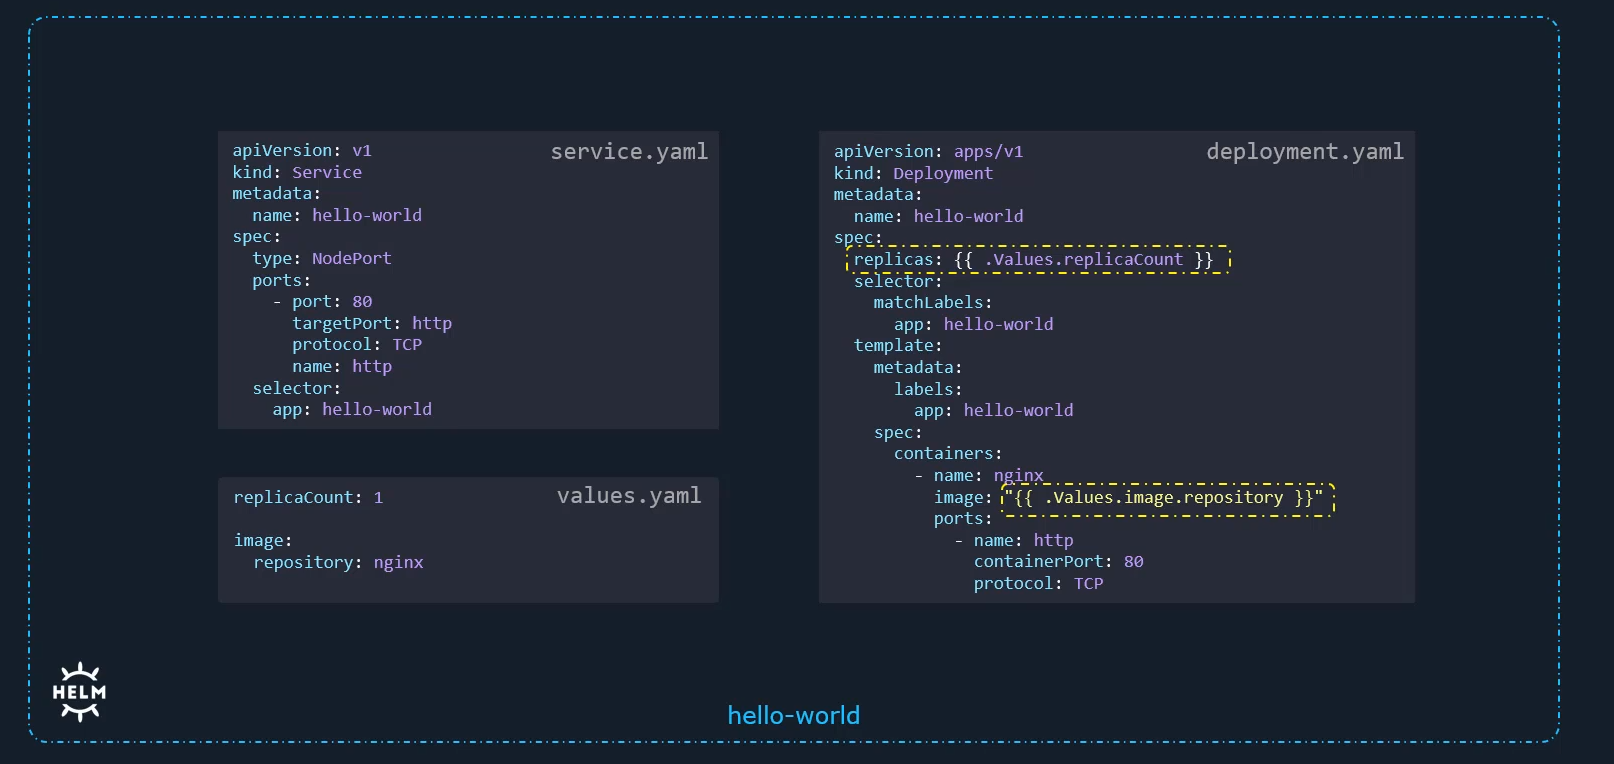 Now in a Helm chart, we’ll often be interacting with a special file. You see, most of the time we won’t need to build the charts ourselves. We have hundreds of them already available to download in the public repository. But what we’ll almost always need to do or want to do is configure the package
that we installed through that chart.
Now in a Helm chart, we’ll often be interacting with a special file. You see, most of the time we won’t need to build the charts ourselves. We have hundreds of them already available to download in the public repository. But what we’ll almost always need to do or want to do is configure the package
that we installed through that chart.
The values.yaml file is where the configurable values are stored, and most of the time, this is the only file you’ll have to modify to customize the deployment of the application for your needs. This is like the settings file or the inputs file for the Helm chart.
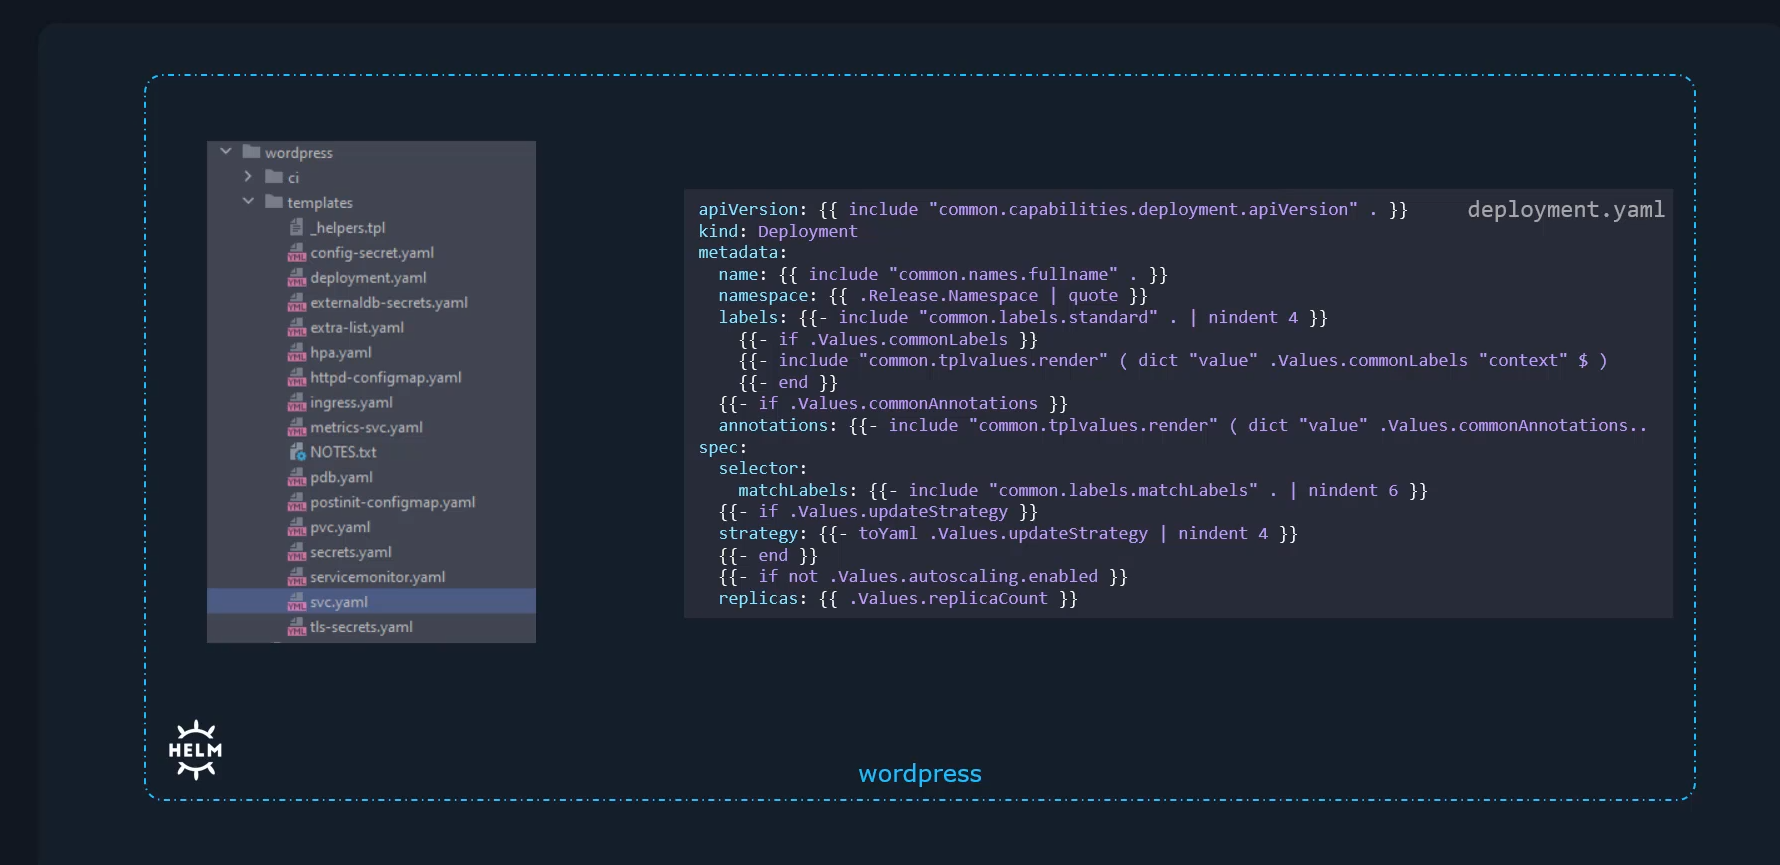 The charts are way more complicated for a WordPress application with so many files and very complex templating. And we will look more into templating and get into the details about these charts later in this course, but for now, we’ll stick with simple charts to understand the basics.
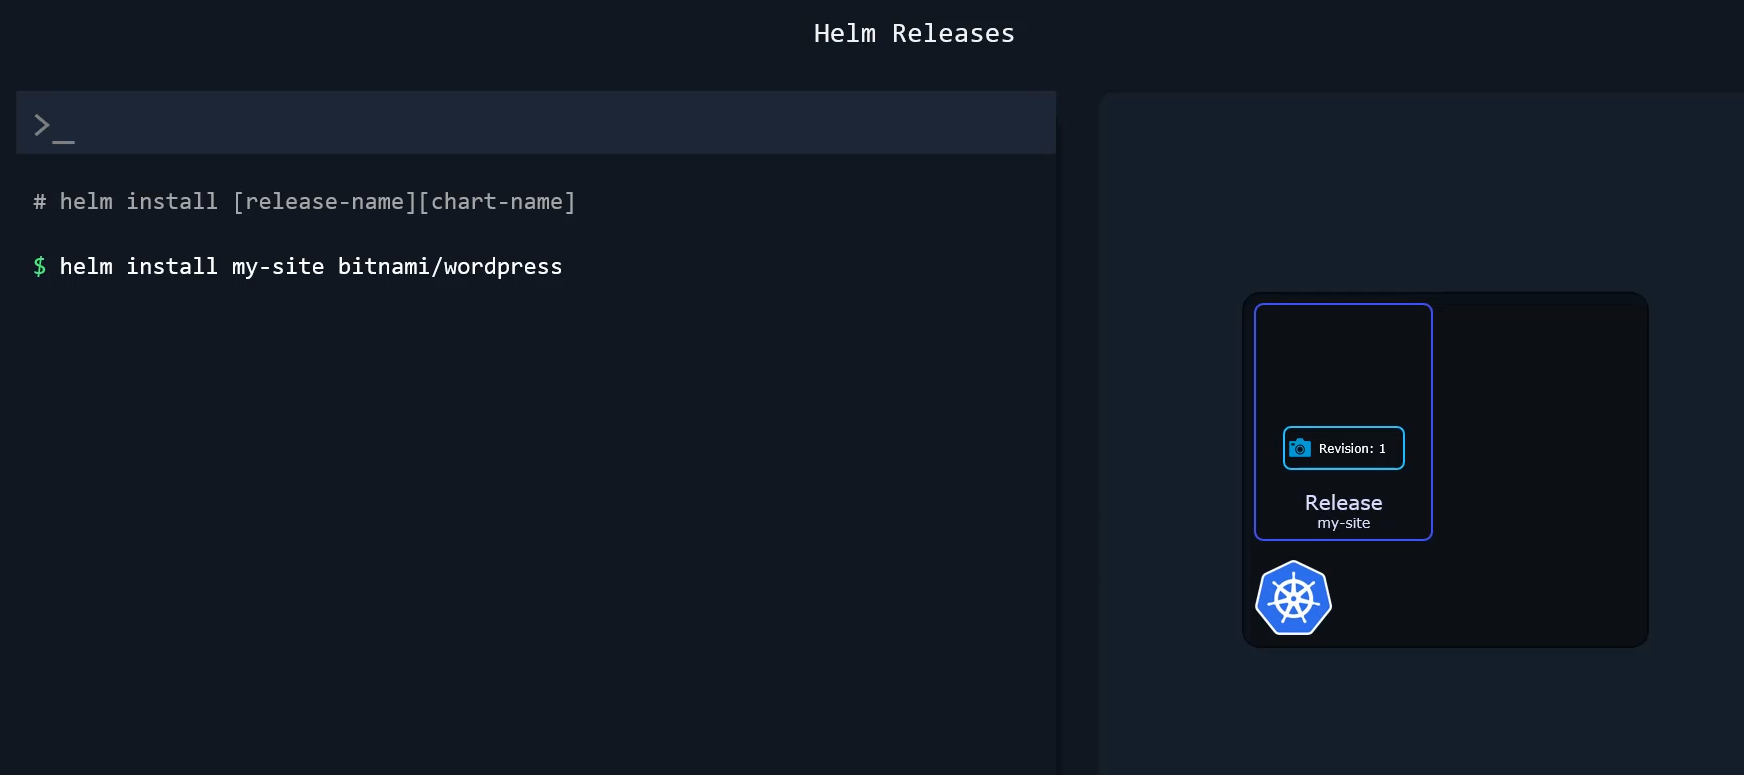 Now, when a chart is applied to your cluster, a release is created. Now we could ask ourselves why the need for an additional item?
Why can’t we just say we installed a chart to Kubernetes?
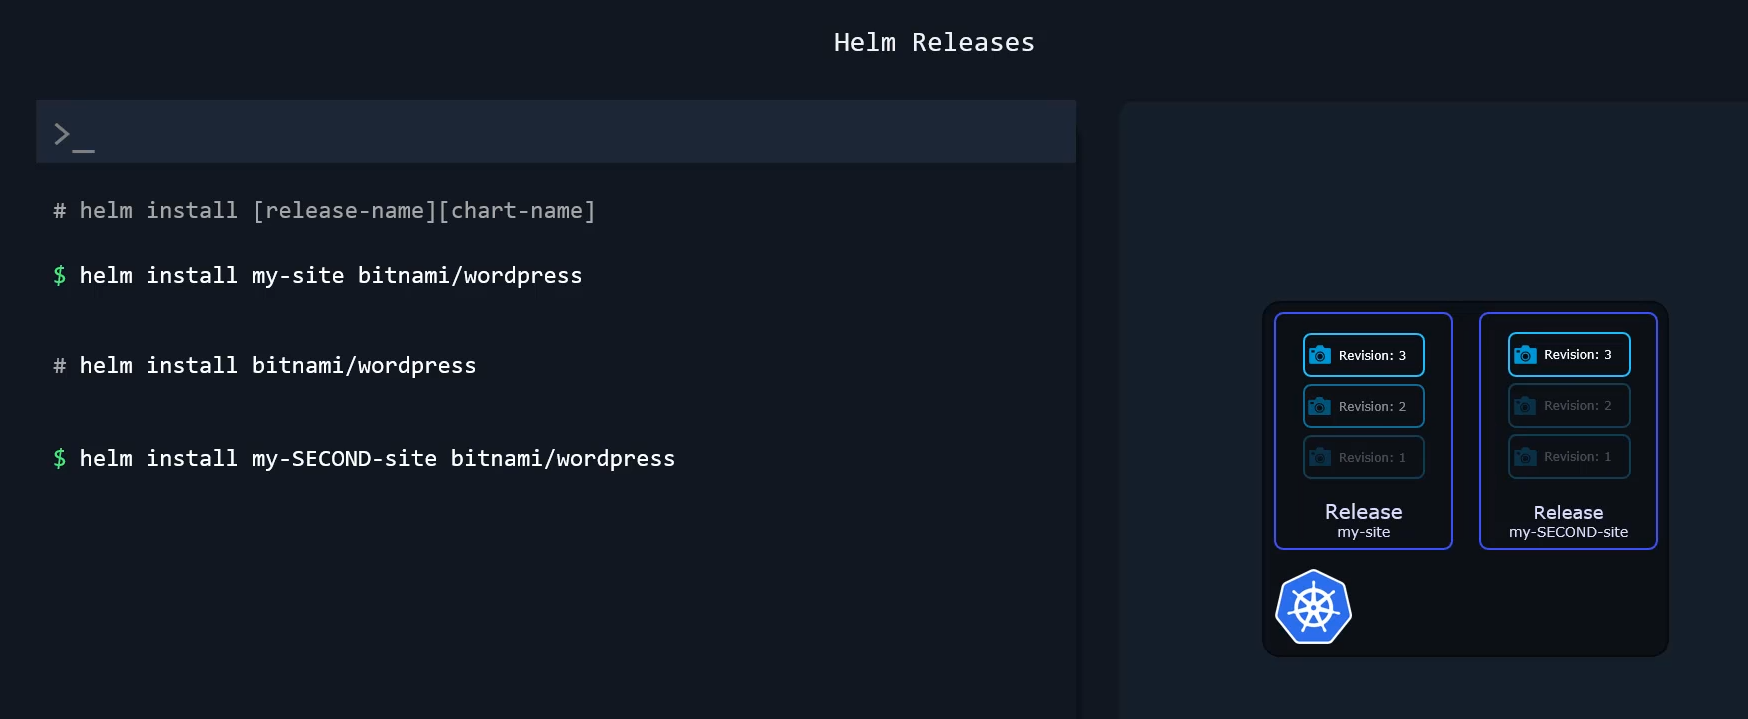
Now in the command helm install my-site bitnami wordpress, we used the chart at Bitnami WordPress and named the release my-site.
So why not just use a shorter command like helm install bitnami wordpress and be done with it?
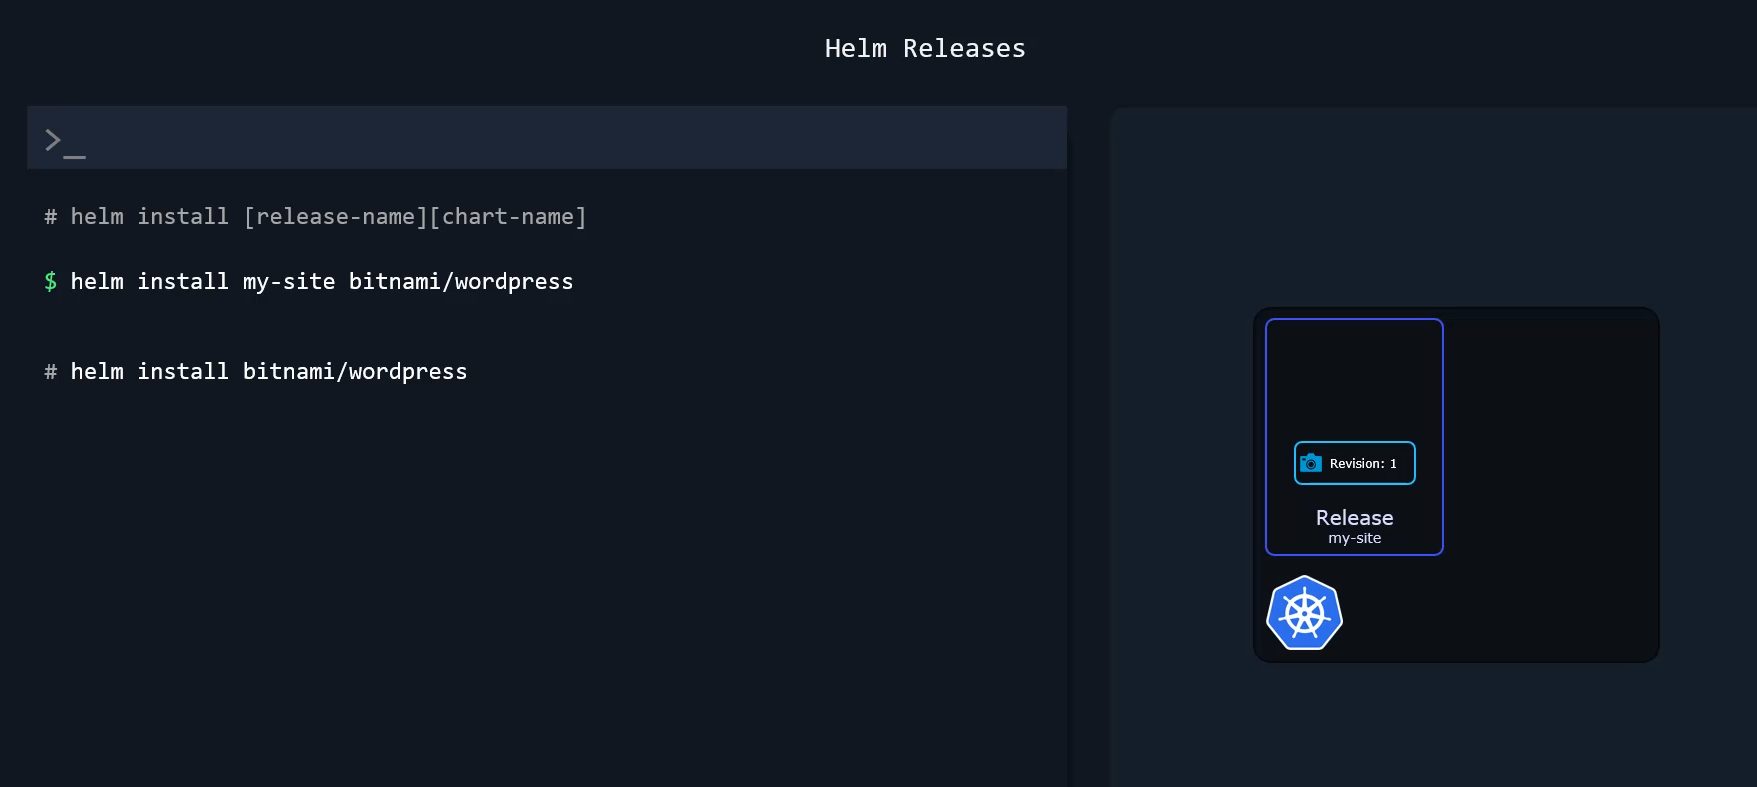 Without specifying a release name.
Well, one simple reason why it makes more sense to have releases based on charts is that we can install multiple releases based on the same chart.
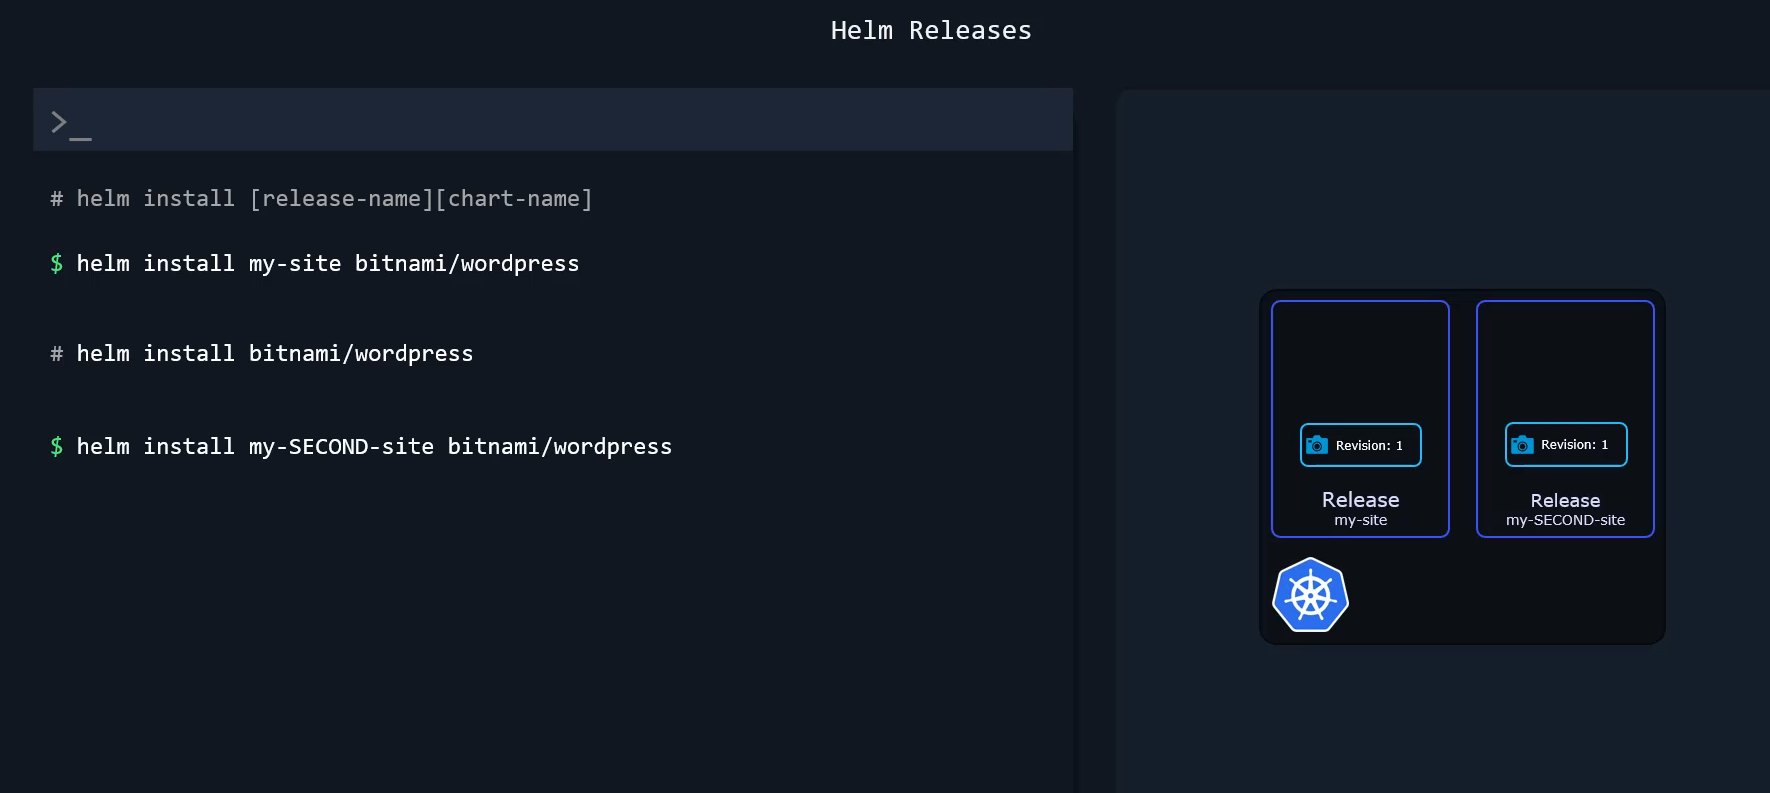
So we can launch a second WordPress website with a command such as helm install my-SECOND-site bitnami wordpress.
And since there are two different releases, they can be tracked separately and changed independently.
 Even though they’re based on the same chart as releases, they’re two entirely different entities.
Now, this can be useful in a lot of scenarios.
For example, you can have a release for a WordPress website that your customers use and another release for a WordPress website that is only visible to your internal team of developers.
There they can experiment and add new features without breaking the main website.
And since the two releases are based on the same chart, once they get something working correctly on the development site, they can transfer it to the main website since it should work exactly the same way as the two websites are basically clones and built the same way.
Now we saw an example of a very basic chart developed in Helm.
And earlier we saw an example of a chart to deploy a WordPress application.
And what if we want to deploy a new chart, say, for deploying Redis or Prometheus, for instance?
Thousands of charts are readily available at different Helm repositories across the world.
There are different providers who are hosting Helm repositories such as AppsCode, Community Operators, TrueCharts, Bitnami, et cetera.
And you don’t have to go to each of these repositories to search for charts.
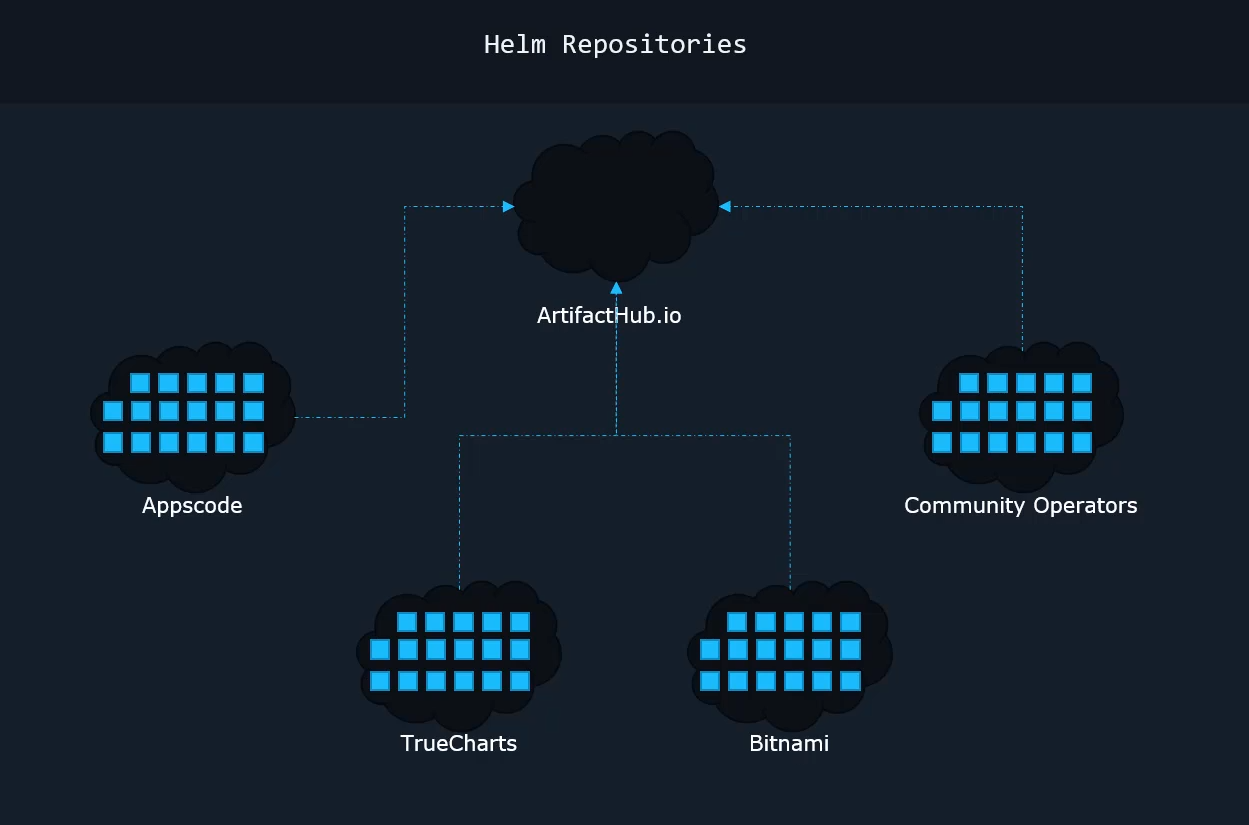 All of these repositories have listed their charts in a single location known as the Helm Hub or Artifact Hub, as it is also known now.
So at Artifacthub.io, you’ll find charts that you can use right away. As of this recording, there are over 6,300 packages available there, and you may search for the chart you’re looking for or browse through available ones, and sometimes the charts are actually published by the actual developers of that project.
So you’ll see the official or verified publisher badges in such cases, and it’s preferable you use those when available.
We’ll see more about installing charts from repositories in the upcoming videos and labs. Well, that’s all for now.